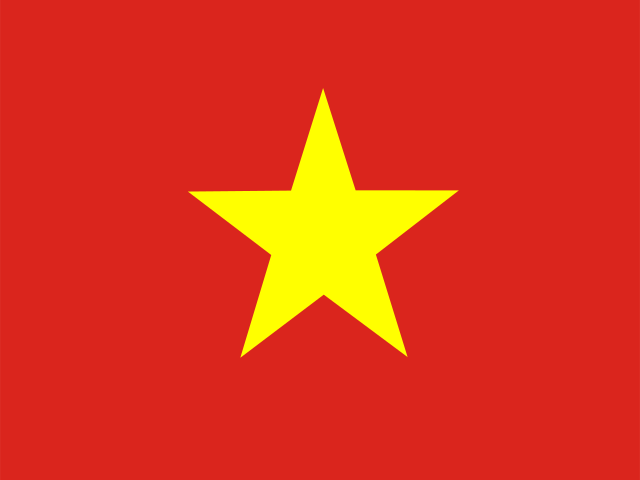
Flagge von Vietnam

Vietnam: Hauptstadt, Einwohner, Fläche und Flagge

Vietnam ist ein Land in Südostasien (Asien). Die Hauptstadt ist Hanoi. Die Einwohnerzahl beträgt etwa 102 Mio. (Platz 16 von 193), die Fläche etwa 331.338 km² (Platz 66 von 193).

Wichtige Fakten

Hauptstadt
Hanoi
Region
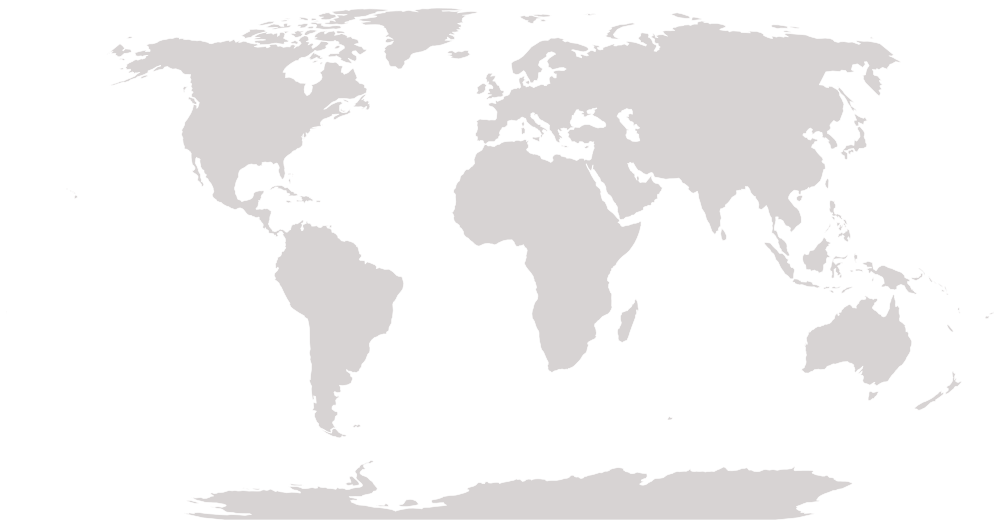
Asien / Südostasien
Einwohnerzahl
101.598.527 (2025) Platz 16 von 193
Gesamtfläche
331.338 km² (2024) Platz 66 von 193
Bevölkerungsdichte
322,2 Einwohner/km² (2024) Platz 27 von 193
Bruttoinlandsprodukt (BIP) insgesamt
515 Mrd. $ (2025) Platz 32 von 189
BIP pro Kopf
5.066 $ (2025) Platz 118 von 189
Lebenserwartung
74,7 Jahre (2024) Platz 87 von 193
Entfernung von Japan
3.667 km Platz 186 von 192
Größte Stadt
Ho-Chi-Minh-Stadt
Fläche im Vergleich zu Japan
etwa das 0,9-Fache Japans
Bevölkerung im Vergleich zu Japan
etwa das 0,8-Fache Japans
Hauptsprachen
Vietnamesisch
Währung
Vietnamesischer Dong (VND)
Landesvorwahl
+84
Zeitzone (Hauptstadt)
UTC+7
Zeitunterschied zu Japan (Normalzeit)
2 Std. früher als in Japan
Fahrtrichtung
Rechtsverkehr
Lage der Hauptstadt
21.02°N 105.84°E

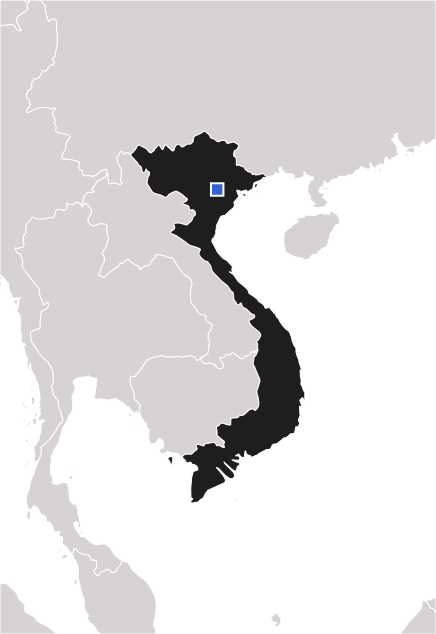
Karte von Vietnam

Karte von Vietnam

Hauptstadt: Hanoi

Vietnam: Nummer eins der Welt

Vietnam liegt bei diesen Feldfrüchten, Tieren, Fischen, Meeresfrüchten und landwirtschaftlichen Erzeugnissen weltweit auf Platz 1 (neueste FAO-Daten). Eines davon auswählen, um die ganze Rangliste zu sehen.

Vietnam: unter den Top 10 der Welt bei Essen & Landwirtschaft

Vietnam gehört bei diesen Feldfrüchten, Tieren, Fischen, Meeresfrüchten und landwirtschaftlichen Erzeugnissen weltweit zu den Top 10 (neueste FAO-Daten).

Nachbarländer an Land

Spitzenplätze

Vietnam gehört zu den Top 10 bei:

Vietnam in den Weltranglisten

So schneidet Vietnam im Vergleich mit anderen Ländern ab, Kennzahl für Kennzahl. Eine Kennzahl anklicken, um die ganze Rangliste zu sehen.

KennzahlWertJahrPlatz
Geografie & Natur
Gesamtfläche331.338 km²2024Platz 66 von 193
Anzahl der Landgrenzen3Platz 80 von 193 gleichauf
Breitengrad der Hauptstadt21,0°Platz 86 von 193
Entfernung von Japan3.667 kmPlatz 186 von 192
Waldfläche (Anteil an der Landfläche)47,1 %2024Platz 56 von 193
Ackerland (Anteil an der Landfläche)21,5 %2024Platz 51 von 190
Schutzgebiete an Land (Anteil an der Landfläche)7,6 %2025Platz 158 von 192 gleichauf
Landwirtschaftsfläche (Anteil an der Landfläche)39,2 %2024Platz 94 von 192
Durchschnittlicher Jahresniederschlag1.821 mm2022Platz 40 von 180
Süßwasservorkommen pro Kopf3.606 m³2022Platz 75 von 181
Waldfläche147.901 km²2025Platz 41 von 193
Meeresschutzgebiete (Anteil an den Hoheitsgewässern)0,5 %2025Platz 109 von 153 gleichauf
Menschen & Bevölkerung
Einwohnerzahl101.598.5272025Platz 16 von 193
Bevölkerungsdichte322,2 Einwohner/km²2024Platz 27 von 193
Bevölkerungswachstum0,60 %2025Platz 120 von 193
Stadtbevölkerung (Anteil der Bevölkerung)38,8 %2025Platz 153 von 193
Lebenserwartung74,7 Jahre2024Platz 87 von 193
Fertilitätsrate (Kinder pro Frau)1,90 Geburten pro Frau2024Platz 101 von 193
Säuglingssterblichkeit12,0 pro 1.000 Geburten2024Platz 101 von 192 gleichauf
Geburtenrate (pro 1.000 Einwohner)13,4 pro 1.000 Einwohner2024Platz 103 von 193
Anteil der Menschen ab 65 Jahren9,5 %2025Platz 82 von 193
Anteil der Kinder von 0 bis 14 Jahren22,9 %2025Platz 105 von 193
Lebenserwartung der Frauen79,4 Jahre2024Platz 75 von 193
Lebenserwartung der Männer70,1 Jahre2024Platz 103 von 193
Müttersterblichkeit48 pro 100.000 Geburten2023Platz 95 von 192 gleichauf
Stadtbewohner in der größten Stadt (Anteil)24,9 %2025Platz 95 von 149
Sterberate (pro 1.000 Einwohner)6,6 pro 1.000 Einwohner2024Platz 118 von 193
Sterblichkeit von Kindern unter 5 Jahren (pro 1.000 Geburten)17,3 pro 1.000 Geburten2024Platz 83 von 192
Bevölkerung im Alter von 15 bis 64 Jahren (Anteil der Bevölkerung)67,6 %2025Platz 44 von 193
Wirtschaft
Bruttoinlandsprodukt (BIP) insgesamt515 Mrd. $2025Platz 32 von 189
BIP pro Kopf5.066 $2025Platz 118 von 189
BIP pro Kopf (Kaufkraftparität)18.088 $2025Platz 100 von 185
Wirtschaftswachstum8,0 %2025Platz 11 von 188
Inflationsrate3,3 %2025Platz 85 von 179
Arbeitslosenquote1,5 %2025Platz 168 von 178
Exporte (Anteil am BIP)98,2 %2025Platz 8 von 168
Importe (Anteil am BIP)92,1 %2025Platz 13 von 168
Landwirtschaft (Anteil am BIP)11,6 %2025Platz 61 von 184
Industrie (Anteil am BIP)37,6 %2025Platz 20 von 185
Dienstleistungen (Anteil am BIP)42,7 %2025Platz 160 von 185
Militärausgaben (Anteil am BIP)2,2 %2025Platz 53 von 155
Einkommensungleichheit (Gini-Koeffizient)36,1 (0–100)2022Platz 61 von 149 gleichauf
Warenexporte (insgesamt)473 Mrd. $2025Platz 16 von 190
Frauen im Erwerbsleben (Anteil der Frauen)68,6 %2025Platz 20 von 178
Jugendarbeitslosigkeit6,2 %2025Platz 144 von 178
Getreideproduktion47.853.478 t2024Platz 14 von 177
Getreideertrag (pro Hektar Anbaufläche)6.038 kg/ha2024Platz 26 von 175
Fisch- und Meeresfrüchteproduktion (Fang + Zucht)9.080.444 t2024Platz 4 von 193
Fischfang (aus Meer, Flüssen und Seen)3.433.839 t2024Platz 7 von 193
Aquakultur (gezüchtete Fische und Meeresfrüchte)5.646.606 t2024Platz 4 von 193
Wachstum der Tierproduktion (2014–16 = 100)148,0 (Durchschnitt 2014–16 = 100)2024Platz 19 von 187
Düngemitteleinsatz (pro Hektar Ackerland)420 kg/ha2024Platz 9 von 187
Verarbeitendes Gewerbe (Anteil am BIP)24,5 %2025Platz 9 von 178
Beschäftigung in der Landwirtschaft (Anteil der Beschäftigten)25,0 %2025Platz 73 von 178
Hightech-Exporte (Anteil an den Exporten von Industriewaren)44,3 %2023Platz 9 von 168
Ausländische Direktinvestitionen, Zuflüsse (Anteil am BIP)4,3 %2025Platz 45 von 187
Erhaltene Entwicklungshilfe (Anteil am Nationaleinkommen)0,2 %2023Platz 113 von 132
Erwerbspersonen (Anzahl)57.041.3232025Platz 12 von 178
Reserven an Devisen und Gold85,6 Mrd. $2025Platz 33 von 169
Extreme Armut (Anteil der Menschen mit weniger als 3,00 $ pro Tag)1,6 %2022Platz 64 von 132 gleichauf
Alltag & Technik
Internetnutzer (Anteil der Bevölkerung)84,2 %2024Platz 81 von 186
Mobilfunkverträge127,6 pro 100 Einwohner2024Platz 59 von 193
Zugang zu Strom (Anteil der Bevölkerung)100,0 %2024Platz 1 von 193 gleichauf
Gesundheitsausgaben (Anteil am BIP)4,6 %2023Platz 134 von 192
Bildungsausgaben (Anteil am BIP)2,9 %2022Platz 141 von 179
Krankenhausbetten2,5 pro 1.000 Einwohner2017Platz 74 von 157 gleichauf
Ärztedichte1,11 pro 1.000 Einwohner2021Platz 113 von 188
Forschungsausgaben (Anteil am BIP)0,41 %2023Platz 67 von 130
Frauenanteil im Parlament31,4 %2025Platz 66 von 192
Studierende an Universitäten und Hochschulen37,6 %2024Platz 100 von 163
Festnetz-Breitbandanschlüsse23,7 pro 100 Einwohner2024Platz 69 von 192
Beförderte Flugpassagiere55.114.8322023Platz 20 von 152
Sicheres Trinkwasser (Anteil der Bevölkerung)58,6 %2024Platz 91 von 136
Sichere Sanitärversorgung (Anteil der Bevölkerung)45,4 %2024Platz 86 von 136
Unterernährung (Anteil der Bevölkerung)6,1 %2024Platz 72 von 165
Saubere Brennstoffe zum Kochen (Anteil der Bevölkerung)91,0 %2024Platz 102 von 192 gleichauf
Verkehrstote30,6 pro 100.000 Einwohner2019Platz 22 von 183
Masernimpfung (Anteil der Kinder)98,0 %2024Platz 20 von 192 gleichauf
Besuch weiterführender Schulen (Bruttoquote)93,4 %2022Platz 84 von 180
Abschlussquote der Grundschule100,6 %2024Platz 27 von 172
Pflegekräfte und Hebammen (pro 1.000 Einwohner)1,44 pro 1.000 Einwohner2016Platz 151 von 190
Tuberkulosefälle (pro 100.000 Einwohner)182 pro 100.000 Einwohner2024Platz 39 von 191
Gesundheitsausgaben pro Kopf197 $2023Platz 128 von 192
Containerumschlag in Häfen (TEU)24.423.183 TEU2024Platz 6 von 150
Umwelt
Strom aus erneuerbaren Energien (Anteil der Stromerzeugung)41,2 %2021Platz 67 von 187
CO₂-Emissionen pro Kopf4,3 t CO₂-Äquivalent pro Kopf2024Platz 56 von 186
CO₂-Emissionen (insgesamt)430,8 Mt CO₂-Äquivalent2024Platz 16 von 186
Luftverschmutzung (Feinstaub PM2,5)24,8 µg/m³2023Platz 62 von 192
Energieverbrauch pro Kopf1.188 kg Öläquivalent pro Kopf2024Platz 83 von 146
Erneuerbare Energien (Anteil am Endenergieverbrauch)24,2 %2021Platz 94 von 191 gleichauf
Stromverbrauch pro Kopf2.756 kWh pro Kopf2024Platz 71 von 146
Strom aus Kernenergie (Anteil am gesamten Strom)0,0 %2021Platz 33 von 190 gleichauf
Strom aus Wasserkraft (Anteil am gesamten Strom)30,3 %2024Platz 64 von 190
Treibhausgasemissionen (insgesamt)584,3 Mt CO₂-Äquivalent2024Platz 15 von 186
Süßwasserentnahme (Anteil an den inneren Ressourcen)22,8 %2022Platz 55 von 175
Ernährung & Landwirtschaft
Reis: Produktion43.450.449 t2024Platz 5 von 114
Mais: Produktion4.402.173 t2024Platz 29 von 160
Hirse: Produktion856 t2024Platz 62 von 73
Kartoffeln: Produktion354.657 t2024Platz 80 von 150
Maniok: Produktion10.533.957 t2024Platz 9 von 92
Süßkartoffeln: Produktion972.890 t2024Platz 13 von 105
Sojabohnen: Produktion46.127 t2024Platz 51 von 101
Erdnüsse: Produktion397.250 t2024Platz 21 von 108
Trockenbohnen: Produktion142.574 t2024Platz 35 von 105
Kokosnüsse: Produktion2.280.323 t2024Platz 5 von 79
Zwiebeln: Produktion367.051 t2024Platz 40 von 139
Kohl: Produktion1.164.883 t2024Platz 9 von 143
Blumenkohl (mit Brokkoli): Produktion197.731 t2024Platz 12 von 95
Pilze (mit Trüffeln): Produktion25.925 t2024Platz 23 von 63
Orangen: Produktion1.915.530 t2024Platz 10 von 112
Bananen: Produktion2.640.250 t2024Platz 12 von 113
Weintrauben: Produktion19.640 t2024Platz 68 von 91
Mangos (mit Guaven und Mangostanen): Produktion1.552.907 t2024Platz 9 von 96
Ananas: Produktion806.529 t2024Platz 12 von 82
Wassermelonen: Produktion1.235.809 t2024Platz 12 von 119
Avocados: Produktion191.662 t2024Platz 11 von 70
Papayas: Produktion134.967 t2024Platz 15 von 68
Grapefruits (mit Pomelos): Produktion1.224.307 t2024Platz 2 von 71
Kaffee: Produktion2.015.289 t2024Platz 2 von 74
Kakaobohnen: Produktion1.500 t2024Platz 32 von 58 gleichauf
Tee: Produktion1.154.510 t2024Platz 6 von 45
Zuckerrohr: Produktion11.843.773 t2024Platz 18 von 93
Baumwolle (Faser): Produktion7 t2023Platz 83 von 85
Tabak: Produktion48.313 t2024Platz 17 von 117
Schwarzer Pfeffer (Piper spp.): Produktion262.230 t2024Platz 1 von 45
Rindfleisch: Produktion270.000 t2024Platz 41 von 181
Schweinefleisch: Produktion3.785.000 t2024Platz 7 von 164
Hühnerfleisch: Produktion1.259.484 t2024Platz 25 von 183
Kuhmilch: Produktion1.276.872 t2024Platz 68 von 178
Hühnereier: Produktion678.088 t2024Platz 23 von 167
Honig: Produktion25.463 t2024Platz 18 von 122
Ziegenfleisch: Produktion24.593 t2024Platz 32 von 164
Butter (mit Ghee): Produktion480 t2023Platz 112 von 124
Weißbeingarnelen (Vannamei-Garnelen): Produktion934.029 t2024Platz 4 von 54
Tigergarnelen (Black Tiger): Produktion288.554 t2024Platz 1 von 26
Riesen-Süßwassergarnelen: Produktion1.791 t2024Platz 7 von 30
Karpfen: Produktion172.905 t2024Platz 3 von 97
Echte Bonitos (Skipjack): Produktion72.642 t2024Platz 16 von 82
Gelbflossen-Thunfische: Produktion23.457 t2024Platz 23 von 82
Großaugen-Thunfische: Produktion1.229 t2024Platz 30 von 68
Weiße Thunfische (Albacore): Produktion285 t2024Platz 31 von 60
Schwertfische: Produktion1.100 t2024Platz 18 von 76
Algen und andere Wasserpflanzen: Produktion11.289 t2024Platz 21 von 68
Garnelen: Produktion1.434.830 t2024Platz 3 von 114
Krabben: Produktion134.938 t2024Platz 3 von 97
Hummer und Langusten: Produktion2.991 t2024Platz 18 von 91
Flusskrebse und andere Süßwasser-Krebstiere: Produktion1.791 t2024Platz 13 von 64
Venusmuscheln und Herzmuscheln: Produktion393.420 t2024Platz 2 von 55
Kalmare, Sepien und Kraken: Produktion363.901 t2024Platz 2 von 102
Thunfische, Bonitos und Schwertfischartige: Produktion477.942 t2024Platz 4 von 133
Karpfen und andere Karpfenfische: Produktion724.842 t2024Platz 5 von 115
Tilapien und andere Buntbarsche: Produktion218.099 t2024Platz 8 von 119
Seeigel, Seegurken und andere Stachelhäuter: Produktion65 t2024Platz 29 von 48
Rinder: Anzahl der Tiere6.212.203 Tiere2024Platz 41 von 183
Schweine: Anzahl der Tiere26.519.409 Tiere2024Platz 6 von 165
Hühner: Anzahl der Tiere481.033.000 Vögel2024Platz 10 von 181
Ziegen: Anzahl der Tiere3.166.435 Tiere2024Platz 52 von 180
Pferde: Anzahl der Tiere46.406 Tiere2024Platz 70 von 143
Büffel: Anzahl der Tiere2.032.396 Tiere2024Platz 7 von 45
Enten: Anzahl der Tiere88.185.000 Vögel2024Platz 2 von 80

Fragen zu Vietnam

Was ist die Hauptstadt von Vietnam?

Die Hauptstadt von Vietnam ist Hanoi.

Wie viele Einwohner hat Vietnam?

Die Einwohnerzahl von Vietnam beträgt etwa 102 Mio. (2025). Im Weltvergleich: Platz 16 von 193.

Wie groß ist Vietnam?

Die Fläche von Vietnam beträgt etwa 331.338 km². Im Weltvergleich: Platz 66 von 193.

Auf welchem Kontinent liegt Vietnam?

Vietnam liegt in Asien, in der Region Südostasien.

Bei welchen Lebensmitteln und landwirtschaftlichen Erzeugnissen ist Vietnam weltweit die Nummer eins?

Vietnam liegt weltweit auf Platz 1 bei: Schwarzer Pfeffer (Piper spp.) 262.000 t, Tigergarnelen (Black Tiger) 289.000 t (FAO-Daten).

Welche Währung und welche Sprachen gibt es in Vietnam?

Währung: Vietnamesischer Dong. Hauptsprachen: Vietnamesisch.

Wie groß ist Vietnam im Vergleich zu Japan, und wie viele Menschen leben dort?

Die Fläche von Vietnam beträgt etwa das 0,9-Fache Japans, die Bevölkerung etwa das 0,8-Fache Japans.

Wie weit ist Vietnam von Japan entfernt?

Die Hauptstadt Hanoi liegt etwa 3.667 km Luftlinie von Tokio, der Hauptstadt Japans, entfernt.

Wie groß ist der Zeitunterschied zwischen Vietnam und Japan?

Die Hauptstadt Hanoi liegt in der Normalzeit bei UTC+7: 2 Std. früher als in Japan.

Was ist die größte Stadt in Vietnam?

Die größte Stadt in Vietnam ist Ho-Chi-Minh-Stadt. Die Hauptstadt ist Hanoi.

Weitere Länder in Südostasien
Mit Vietnam spielen

Im Quiz testen, was Sie gelernt haben.

Kartenpuzzle Quiz Ranglisten

Nach oben