
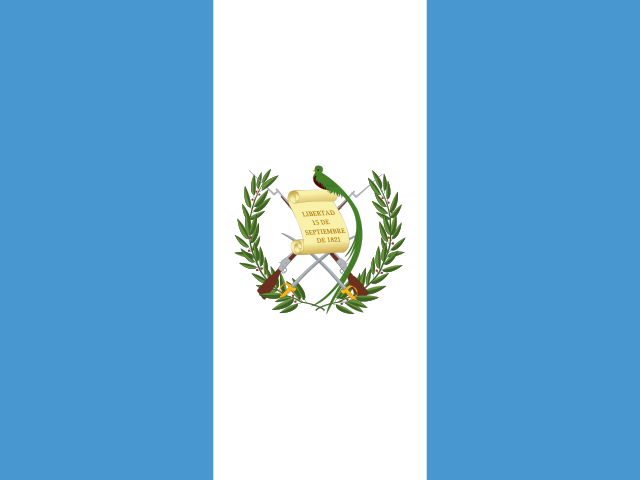
Guatemala: Hauptstadt, Einwohner, Fläche und Flagge
Guatemala ist ein Land in Mittelamerika (Nordamerika). Die Hauptstadt ist Guatemala-Stadt. Die Einwohnerzahl beträgt etwa 18,7 Mio. (Platz 69 von 193), die Fläche etwa 108.889 km² (Platz 105 von 193).
Wichtige Fakten
- Hauptstadt
- Guatemala-Stadt
- Region
- Nordamerika / Mittelamerika
- Einwohnerzahl
- 18.687.881 (2025) Platz 69 von 193
- Gesamtfläche
- 108.889 km² (2024) Platz 105 von 193
- Bevölkerungsdichte
- 171,8 Einwohner/km² (2024) Platz 54 von 193
- Bruttoinlandsprodukt (BIP) insgesamt
- 123 Mrd. $ (2025) Platz 66 von 189
- BIP pro Kopf
- 6.598 $ (2025) Platz 104 von 189
- Lebenserwartung
- 72,7 Jahre (2024) Platz 106 von 193
- Entfernung von Japan
- 12.323 km Platz 62 von 192
- Fläche im Vergleich zu Japan
- etwa 1/3 von Japan
- Bevölkerung im Vergleich zu Japan
- etwa 1/7 von Japan
- Hauptsprachen
- Spanisch
- Währung
- Guatemaltekischer Quetzal (GTQ)
- Landesvorwahl
- +502
- Zeitzone (Hauptstadt)
- UTC-6
- Zeitunterschied zu Japan (Normalzeit)
- 15 Std. früher als in Japan
- Fahrtrichtung
- Rechtsverkehr
- Lage der Hauptstadt
- 14.64°N 90.51°W
Bevölkerung von Guatemala, 1950–2100 (auf Japanisch)
Sieh dir frühere Schätzungen, künftige Prognosen und die Bevölkerungspyramide in der Weltbevölkerungs-Zeitmaschine an.
Karte von Guatemala
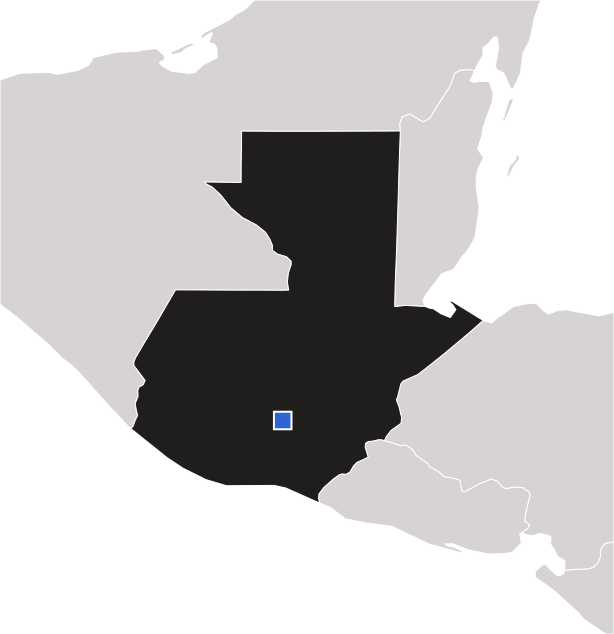
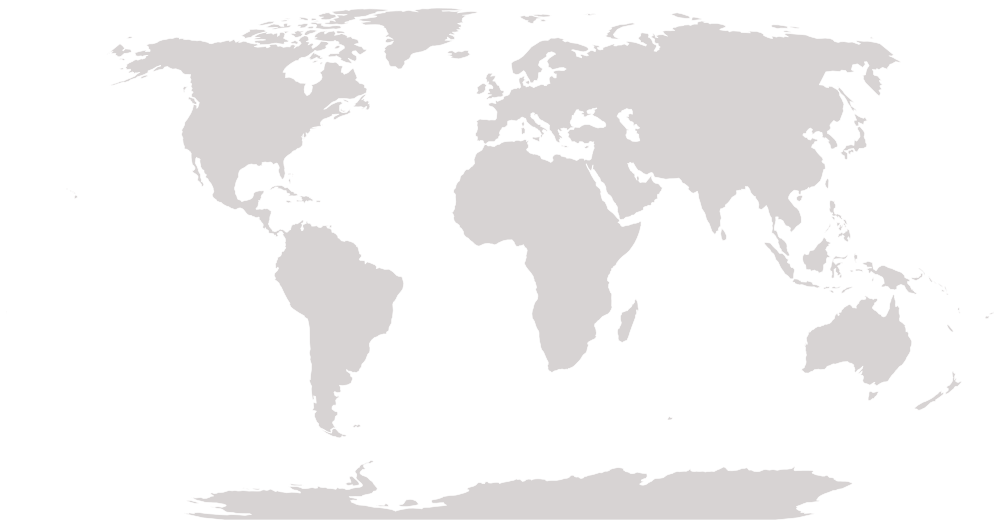
Hauptstadt: Guatemala-Stadt
Guatemala: unter den Top 10 der Welt bei Essen & Landwirtschaft
Guatemala gehört bei diesen Feldfrüchten, Tieren, Fischen, Meeresfrüchten und landwirtschaftlichen Erzeugnissen weltweit zu den Top 10 (neueste FAO-Daten).
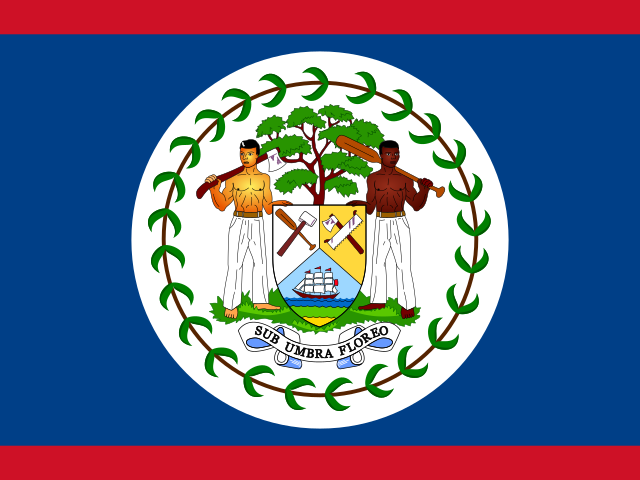
Nachbarländer an Land

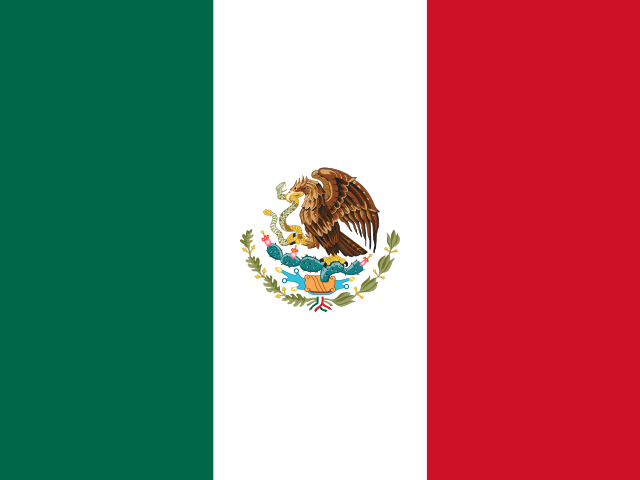
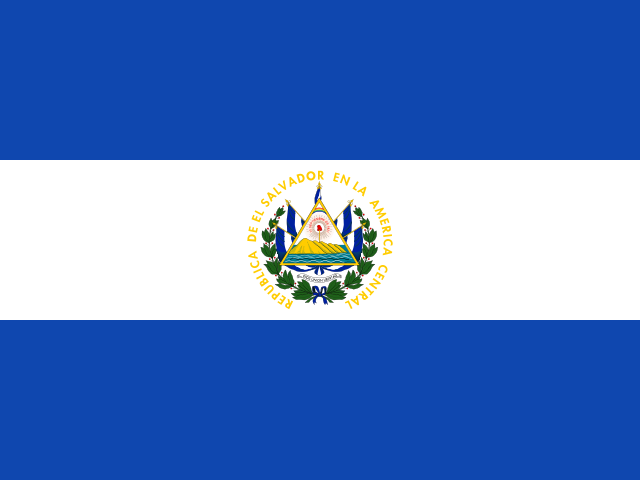
Guatemala in den Weltranglisten
So schneidet Guatemala im Vergleich mit anderen Ländern ab, Kennzahl für Kennzahl. Eine Kennzahl anklicken, um die ganze Rangliste zu sehen.
| Kennzahl | Wert | Jahr | Platz |
|---|---|---|---|
| Geografie & Natur | |||
| Gesamtfläche | 108.889 km² | 2024 | Platz 105 von 193 |
| Anzahl der Landgrenzen | 4 | Platz 56 von 193 gleichauf | |
| Breitengrad der Hauptstadt | 14,6° | Platz 103 von 193 | |
| Entfernung von Japan | 12.323 km | Platz 62 von 192 | |
| Waldfläche (Anteil an der Landfläche) | 33,1 % | 2024 | Platz 95 von 193 |
| Ackerland (Anteil an der Landfläche) | 17,5 % | 2024 | Platz 61 von 190 |
| Schutzgebiete an Land (Anteil an der Landfläche) | 20,1 % | 2025 | Platz 83 von 192 |
| Landwirtschaftsfläche (Anteil an der Landfläche) | 46,0 % | 2024 | Platz 72 von 192 |
| Durchschnittlicher Jahresniederschlag | 1.996 mm | 2022 | Platz 33 von 180 |
| Süßwasservorkommen pro Kopf | 6.118 m³ | 2022 | Platz 62 von 181 |
| Waldfläche | 35.357 km² | 2025 | Platz 82 von 193 |
| Meeresschutzgebiete (Anteil an den Hoheitsgewässern) | 0,9 % | 2025 | Platz 93 von 153 gleichauf |
| Menschen & Bevölkerung | |||
| Einwohnerzahl | 18.687.881 | 2025 | Platz 69 von 193 |
| Bevölkerungsdichte | 171,8 Einwohner/km² | 2024 | Platz 54 von 193 |
| Bevölkerungswachstum | 1,52 % | 2025 | Platz 67 von 193 |
| Stadtbevölkerung (Anteil der Bevölkerung) | 56,3 % | 2025 | Platz 117 von 193 |
| Lebenserwartung | 72,7 Jahre | 2024 | Platz 106 von 193 |
| Fertilitätsrate (Kinder pro Frau) | 2,29 Geburten pro Frau | 2024 | Platz 82 von 193 |
| Säuglingssterblichkeit | 17,2 pro 1.000 Geburten | 2024 | Platz 73 von 192 |
| Geburtenrate (pro 1.000 Einwohner) | 20,6 pro 1.000 Einwohner | 2024 | Platz 69 von 193 |
| Anteil der Menschen ab 65 Jahren | 5,0 % | 2025 | Platz 125 von 193 |
| Anteil der Kinder von 0 bis 14 Jahren | 31,0 % | 2025 | Platz 66 von 193 |
| Lebenserwartung der Frauen | 75,0 Jahre | 2024 | Platz 113 von 193 |
| Lebenserwartung der Männer | 70,4 Jahre | 2024 | Platz 99 von 193 |
| Müttersterblichkeit | 94 pro 100.000 Geburten | 2023 | Platz 68 von 192 |
| Stadtbewohner in der größten Stadt (Anteil) | 30,7 % | 2025 | Platz 70 von 149 |
| Sterberate (pro 1.000 Einwohner) | 4,9 pro 1.000 Einwohner | 2024 | Platz 176 von 193 |
| Sterblichkeit von Kindern unter 5 Jahren (pro 1.000 Geburten) | 20,5 pro 1.000 Geburten | 2024 | Platz 72 von 192 |
| Bevölkerung im Alter von 15 bis 64 Jahren (Anteil der Bevölkerung) | 64,0 % | 2025 | Platz 102 von 193 |
| Wirtschaft | |||
| Bruttoinlandsprodukt (BIP) insgesamt | 123 Mrd. $ | 2025 | Platz 66 von 189 |
| BIP pro Kopf | 6.598 $ | 2025 | Platz 104 von 189 |
| BIP pro Kopf (Kaufkraftparität) | 15.197 $ | 2025 | Platz 109 von 185 |
| Wirtschaftswachstum | 4,3 % | 2025 | Platz 64 von 188 |
| Inflationsrate | 1,5 % | 2025 | Platz 134 von 179 |
| Arbeitslosenquote | 2,6 % | 2025 | Platz 154 von 178 |
| Exporte (Anteil am BIP) | 15,6 % | 2025 | Platz 147 von 168 |
| Importe (Anteil am BIP) | 31,0 % | 2025 | Platz 117 von 168 |
| Landwirtschaft (Anteil am BIP) | 9,6 % | 2025 | Platz 70 von 184 |
| Industrie (Anteil am BIP) | 21,8 % | 2025 | Platz 114 von 185 |
| Dienstleistungen (Anteil am BIP) | 62,1 % | 2025 | Platz 61 von 185 |
| Militärausgaben (Anteil am BIP) | 0,5 % | 2025 | Platz 143 von 155 |
| Einkommensungleichheit (Gini-Koeffizient) | 45,2 (0–100) | 2023 | Platz 15 von 149 |
| Warenexporte (insgesamt) | 15,6 Mrd. $ | 2025 | Platz 86 von 190 |
| Überweisungen von Arbeitskräften im Ausland (Anteil am BIP) | 20,8 % | 2025 | Platz 13 von 170 |
| Frauen im Erwerbsleben (Anteil der Frauen) | 38,3 % | 2025 | Platz 149 von 178 |
| Jugendarbeitslosigkeit | 4,8 % | 2025 | Platz 154 von 178 |
| Getreideproduktion | 2.331.190 t | 2024 | Platz 87 von 177 |
| Getreideertrag (pro Hektar Anbaufläche) | 2.238 kg/ha | 2024 | Platz 109 von 175 |
| Fisch- und Meeresfrüchteproduktion (Fang + Zucht) | 39.980 t | 2024 | Platz 115 von 193 |
| Fischfang (aus Meer, Flüssen und Seen) | 14.208 t | 2024 | Platz 135 von 193 |
| Aquakultur (gezüchtete Fische und Meeresfrüchte) | 25.773 t | 2024 | Platz 58 von 193 |
| Wachstum der Tierproduktion (2014–16 = 100) | 138,9 (Durchschnitt 2014–16 = 100) | 2024 | Platz 27 von 187 |
| Düngemitteleinsatz (pro Hektar Ackerland) | 205 kg/ha | 2024 | Platz 34 von 187 |
| Verarbeitendes Gewerbe (Anteil am BIP) | 13,2 % | 2025 | Platz 60 von 178 |
| Beschäftigung in der Landwirtschaft (Anteil der Beschäftigten) | 29,1 % | 2025 | Platz 62 von 178 |
| Hightech-Exporte (Anteil an den Exporten von Industriewaren) | 5,4 % | 2024 | Platz 91 von 168 |
| Ausländische Direktinvestitionen, Zuflüsse (Anteil am BIP) | 1,4 % | 2025 | Platz 115 von 187 |
| Erhaltene Entwicklungshilfe (Anteil am Nationaleinkommen) | 0,4 % | 2023 | Platz 104 von 132 |
| Erwerbspersonen (Anzahl) | 7.684.762 | 2025 | Platz 68 von 178 |
| Reserven an Devisen und Gold | 32,8 Mrd. $ | 2025 | Platz 57 von 169 |
| Extreme Armut (Anteil der Menschen mit weniger als 3,00 $ pro Tag) | 9,7 % | 2023 | Platz 35 von 132 |
| Alltag & Technik | |||
| Internetnutzer (Anteil der Bevölkerung) | 60,2 % | 2024 | Platz 134 von 186 |
| Mobilfunkverträge | 112,5 pro 100 Einwohner | 2024 | Platz 107 von 193 |
| Zugang zu Strom (Anteil der Bevölkerung) | 90,9 % | 2024 | Platz 138 von 193 |
| Gesundheitsausgaben (Anteil am BIP) | 6,8 % | 2023 | Platz 89 von 192 |
| Bildungsausgaben (Anteil am BIP) | 3,1 % | 2024 | Platz 136 von 179 |
| Krankenhausbetten | 0,5 pro 1.000 Einwohner | 2023 | Platz 148 von 157 |
| Ärztedichte | 1,28 pro 1.000 Einwohner | 2020 | Platz 108 von 188 |
| Forschungsausgaben (Anteil am BIP) | 0,01 % | 2023 | Platz 130 von 130 |
| Frauenanteil im Parlament | 20,0 % | 2025 | Platz 124 von 192 gleichauf |
| Studierende an Universitäten und Hochschulen | 27,3 % | 2023 | Platz 108 von 163 |
| Festnetz-Breitbandanschlüsse | 5,3 pro 100 Einwohner | 2024 | Platz 123 von 192 |
| Beförderte Flugpassagiere | 221.478 | 2023 | Platz 126 von 152 |
| Sicheres Trinkwasser (Anteil der Bevölkerung) | 48,8 % | 2024 | Platz 95 von 136 |
| Unterernährung (Anteil der Bevölkerung) | 12,7 % | 2024 | Platz 43 von 165 gleichauf |
| Saubere Brennstoffe zum Kochen (Anteil der Bevölkerung) | 51,0 % | 2024 | Platz 137 von 192 gleichauf |
| Verkehrstote | 22,9 pro 100.000 Einwohner | 2019 | Platz 54 von 183 |
| Masernimpfung (Anteil der Kinder) | 90,0 % | 2024 | Platz 92 von 192 gleichauf |
| Besuch weiterführender Schulen (Bruttoquote) | 49,6 % | 2024 | Platz 156 von 180 |
| Abschlussquote der Grundschule | 86,5 % | 2024 | Platz 120 von 172 |
| Pflegekräfte und Hebammen (pro 1.000 Einwohner) | 2,27 pro 1.000 Einwohner | 2023 | Platz 120 von 190 gleichauf |
| Tuberkulosefälle (pro 100.000 Einwohner) | 28 pro 100.000 Einwohner | 2024 | Platz 114 von 191 gleichauf |
| Gesundheitsausgaben pro Kopf | 392 $ | 2023 | Platz 103 von 192 |
| Containerumschlag in Häfen (TEU) | 2.010.490 TEU | 2024 | Platz 48 von 150 |
| Umwelt | |||
| Strom aus erneuerbaren Energien (Anteil der Stromerzeugung) | 60,6 % | 2021 | Platz 54 von 187 |
| CO₂-Emissionen pro Kopf | 1,1 t CO₂-Äquivalent pro Kopf | 2024 | Platz 126 von 186 |
| CO₂-Emissionen (insgesamt) | 20,4 Mt CO₂-Äquivalent | 2024 | Platz 88 von 186 |
| Luftverschmutzung (Feinstaub PM2,5) | 29,7 µg/m³ | 2023 | Platz 50 von 192 |
| Energieverbrauch pro Kopf | 940 kg Öläquivalent pro Kopf | 2024 | Platz 90 von 146 |
| Erneuerbare Energien (Anteil am Endenergieverbrauch) | 62,1 % | 2021 | Platz 35 von 191 |
| Stromverbrauch pro Kopf | 743 kWh pro Kopf | 2024 | Platz 112 von 146 |
| Strom aus Kernenergie (Anteil am gesamten Strom) | 0,0 % | 2021 | Platz 33 von 190 gleichauf |
| Strom aus Wasserkraft (Anteil am gesamten Strom) | 26,3 % | 2024 | Platz 73 von 190 |
| Treibhausgasemissionen (insgesamt) | 43,5 Mt CO₂-Äquivalent | 2024 | Platz 86 von 186 |
| Süßwasserentnahme (Anteil an den inneren Ressourcen) | 3,0 % | 2022 | Platz 118 von 175 |
| Ernährung & Landwirtschaft | |||
| Weizen: Produktion | 762 t | 2024 | Platz 115 von 120 |
| Reis: Produktion | 31.700 t | 2024 | Platz 88 von 114 |
| Mais: Produktion | 2.261.090 t | 2024 | Platz 42 von 160 |
| Gerste: Produktion | 18 t | 2024 | Platz 100 von 100 |
| Sorghum: Produktion | 37.620 t | 2024 | Platz 53 von 107 |
| Kartoffeln: Produktion | 550.783 t | 2024 | Platz 62 von 150 |
| Maniok: Produktion | 1.645 t | 2024 | Platz 77 von 92 |
| Süßkartoffeln: Produktion | 4.565 t | 2024 | Platz 77 von 105 |
| Sojabohnen: Produktion | 45.000 t | 2024 | Platz 52 von 101 |
| Erdnüsse: Produktion | 9.902 t | 2024 | Platz 69 von 108 |
| Trockenbohnen: Produktion | 120.127 t | 2024 | Platz 37 von 105 |
| Kokosnüsse: Produktion | 13.595 t | 2024 | Platz 50 von 79 |
| Palmöl: Produktion | 933.926 t | 2023 | Platz 6 von 45 |
| Tomaten: Produktion | 452.936 t | 2024 | Platz 48 von 164 |
| Zwiebeln: Produktion | 192.857 t | 2024 | Platz 58 von 139 |
| Kohl: Produktion | 66.350 t | 2024 | Platz 59 von 143 |
| Karotten (mit Speiserüben): Produktion | 120.334 t | 2024 | Platz 44 von 129 |
| Salat (mit Chicorée): Produktion | 104.813 t | 2024 | Platz 20 von 102 |
| Blumenkohl (mit Brokkoli): Produktion | 44.863 t | 2024 | Platz 30 von 95 |
| Grüne Chilis und Paprika: Produktion | 88.104 t | 2024 | Platz 43 von 124 |
| Knoblauch: Produktion | 30.318 t | 2024 | Platz 29 von 102 |
| Orangen: Produktion | 108.846 t | 2024 | Platz 45 von 112 |
| Zitronen (mit Limetten): Produktion | 109.585 t | 2024 | Platz 22 von 101 |
| Äpfel: Produktion | 25.473 t | 2024 | Platz 69 von 92 |
| Bananen: Produktion | 2.843.487 t | 2024 | Platz 10 von 113 |
| Weintrauben: Produktion | 20.313 t | 2024 | Platz 67 von 91 |
| Mangos (mit Guaven und Mangostanen): Produktion | 180.577 t | 2024 | Platz 28 von 96 |
| Ananas: Produktion | 436.741 t | 2024 | Platz 20 von 82 |
| Erdbeeren: Produktion | 14.331 t | 2024 | Platz 35 von 80 |
| Wassermelonen: Produktion | 59.005 t | 2024 | Platz 72 von 119 |
| Pfirsiche (mit Nektarinen): Produktion | 49.214 t | 2024 | Platz 33 von 79 |
| Avocados: Produktion | 117.248 t | 2024 | Platz 22 von 70 |
| Melonen (Cantaloupe-Melonen und andere): Produktion | 767.019 t | 2024 | Platz 7 von 95 |
| Papayas: Produktion | 87.018 t | 2024 | Platz 19 von 68 |
| Kaffee: Produktion | 224.860 t | 2024 | Platz 11 von 74 |
| Kakaobohnen: Produktion | 11.701 t | 2024 | Platz 24 von 58 |
| Tee: Produktion | 539 t | 2024 | Platz 40 von 45 |
| Zuckerrohr: Produktion | 22.907.870 t | 2024 | Platz 11 von 93 |
| Baumwolle (Faser): Produktion | 592 t | 2023 | Platz 65 von 85 |
| Tabak: Produktion | 30.621 t | 2024 | Platz 21 von 117 |
| Schwarzer Pfeffer (Piper spp.): Produktion | 808 t | 2024 | Platz 24 von 45 |
| Rindfleisch: Produktion | 312.602 t | 2024 | Platz 40 von 181 |
| Schweinefleisch: Produktion | 44.058 t | 2024 | Platz 68 von 164 |
| Hühnerfleisch: Produktion | 391.942 t | 2024 | Platz 46 von 183 |
| Kuhmilch: Produktion | 540.070 t | 2024 | Platz 89 von 178 |
| Hühnereier: Produktion | 263.635 t | 2024 | Platz 36 von 167 |
| Honig: Produktion | 2.203 t | 2024 | Platz 70 von 122 |
| Schaffleisch (Hammel und Lamm): Produktion | 2.033 t | 2024 | Platz 106 von 172 |
| Ziegenfleisch: Produktion | 165 t | 2024 | Platz 129 von 164 |
| Ziegenmilch: Produktion | 2.616 t | 2024 | Platz 94 von 108 |
| Butter (mit Ghee): Produktion | 1.876 t | 2023 | Platz 92 von 124 |
| Käse (alle Sorten): Produktion | 18.179 t | 2023 | Platz 69 von 105 |
| Weißbeingarnelen (Vannamei-Garnelen): Produktion | 9.100 t | 2024 | Platz 18 von 54 |
| Karpfen: Produktion | 5 t | 2024 | Platz 87 von 97 gleichauf |
| Regenbogenforellen: Produktion | 77 t | 2024 | Platz 65 von 79 |
| Echte Bonitos (Skipjack): Produktion | 6.411 t | 2024 | Platz 37 von 82 |
| Gelbflossen-Thunfische: Produktion | 3.019 t | 2024 | Platz 45 von 82 |
| Großaugen-Thunfische: Produktion | 750 t | 2024 | Platz 33 von 68 |
| Schwertfische: Produktion | 1 t | 2024 | Platz 73 von 76 |
| Garnelen: Produktion | 9.368 t | 2024 | Platz 41 von 114 |
| Kalmare, Sepien und Kraken: Produktion | 4 t | 2024 | Platz 97 von 102 |
| Thunfische, Bonitos und Schwertfischartige: Produktion | 11.001 t | 2024 | Platz 58 von 133 |
| Karpfen und andere Karpfenfische: Produktion | 5 t | 2024 | Platz 107 von 115 |
| Tilapien und andere Buntbarsche: Produktion | 16.701 t | 2024 | Platz 33 von 119 |
| Haie und Rochen: Produktion | 61 t | 2024 | Platz 95 von 127 |
| Rinder: Anzahl der Tiere | 4.343.871 Tiere | 2024 | Platz 57 von 183 |
| Schweine: Anzahl der Tiere | 3.044.525 Tiere | 2024 | Platz 35 von 165 |
| Hühner: Anzahl der Tiere | 47.162.000 Vögel | 2024 | Platz 64 von 181 |
| Schafe: Anzahl der Tiere | 611.329 Tiere | 2024 | Platz 93 von 173 |
| Ziegen: Anzahl der Tiere | 116.005 Tiere | 2024 | Platz 118 von 180 |
| Pferde: Anzahl der Tiere | 133.195 Tiere | 2024 | Platz 46 von 143 |
| Esel: Anzahl der Tiere | 9.671 Tiere | 2024 | Platz 67 von 104 |
Fragen zu Guatemala
Was ist die Hauptstadt von Guatemala?
Die Hauptstadt von Guatemala ist Guatemala-Stadt.
Wie viele Einwohner hat Guatemala?
Die Einwohnerzahl von Guatemala beträgt etwa 18,7 Mio. (2025). Im Weltvergleich: Platz 69 von 193.
Wie groß ist Guatemala?
Die Fläche von Guatemala beträgt etwa 108.889 km². Im Weltvergleich: Platz 105 von 193.
Auf welchem Kontinent liegt Guatemala?
Guatemala liegt in Nordamerika, in der Region Mittelamerika.
Welche Währung und welche Sprachen gibt es in Guatemala?
Währung: Guatemaltekischer Quetzal. Hauptsprachen: Spanisch.
Wie groß ist Guatemala im Vergleich zu Japan, und wie viele Menschen leben dort?
Die Fläche von Guatemala beträgt etwa 1/3 von Japan, die Bevölkerung etwa 1/7 von Japan.
Wie weit ist Guatemala von Japan entfernt?
Die Hauptstadt Guatemala-Stadt liegt etwa 12.323 km Luftlinie von Tokio, der Hauptstadt Japans, entfernt.
Wie groß ist der Zeitunterschied zwischen Guatemala und Japan?
Die Hauptstadt Guatemala-Stadt liegt in der Normalzeit bei UTC-6: 15 Std. früher als in Japan.
Weitere Länder in Mittelamerika
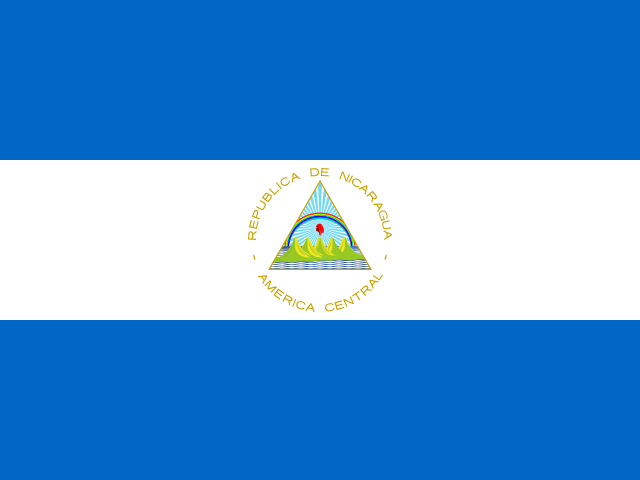

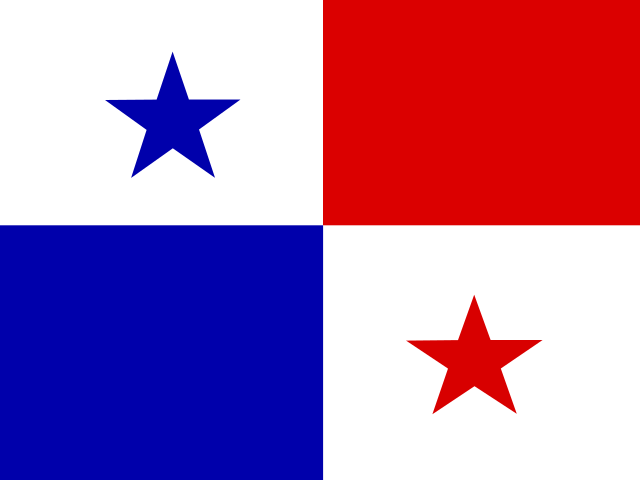
Mit Guatemala spielen
Im Quiz testen, was Sie gelernt haben.