

Israel: Hauptstadt, Einwohner, Fläche und Flagge
Israel ist ein Land in Westasien (Asien). Die Hauptstadt ist Jerusalem. Die Einwohnerzahl beträgt etwa 10,1 Mio. (Platz 95 von 193), die Fläche etwa 22.070 km² (Platz 148 von 193).
Wichtige Fakten
- Hauptstadt
- Jerusalem
- Region
- Asien / Westasien
- Einwohnerzahl
- 10.122.800 (2025) Platz 95 von 193
- Gesamtfläche
- 22.070 km² (2024) Platz 148 von 193
- Bevölkerungsdichte
- 462,2 Einwohner/km² (2024) Platz 18 von 193
- Bruttoinlandsprodukt (BIP) insgesamt
- 611 Mrd. $ (2025) Platz 26 von 189
- BIP pro Kopf
- 60.337 $ (2025) Platz 18 von 189
- Lebenserwartung
- 83,2 Jahre (2024) Platz 13 von 193
- Entfernung von Japan
- 9.146 km Platz 116 von 192
- Fläche im Vergleich zu Japan
- etwa 1/17 von Japan
- Bevölkerung im Vergleich zu Japan
- etwa 1/12 von Japan
- Hauptsprachen
- Hebräisch
- Währung
- Israelischer Neuer Schekel (ILS)
- Landesvorwahl
- +972
- Zeitzone (Hauptstadt)
- UTC+2 (mit Sommerzeit)
- Zeitunterschied zu Japan (Normalzeit)
- 7 Std. früher als in Japan
- Fahrtrichtung
- Rechtsverkehr
- Lage der Hauptstadt
- 31.78°N 35.23°E
Bevölkerung von Israel, 1950–2100 (auf Japanisch)
Sieh dir frühere Schätzungen, künftige Prognosen und die Bevölkerungspyramide in der Weltbevölkerungs-Zeitmaschine an.
Karte von Israel
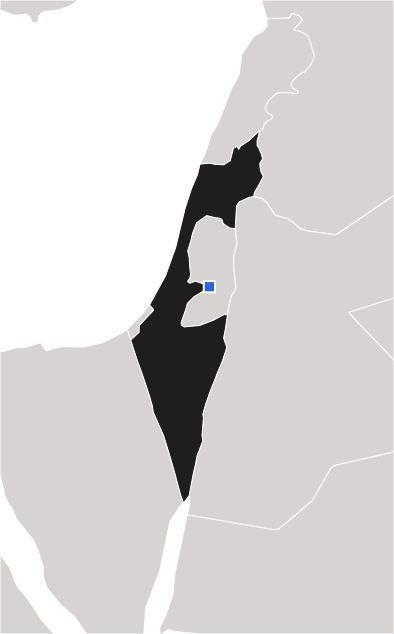
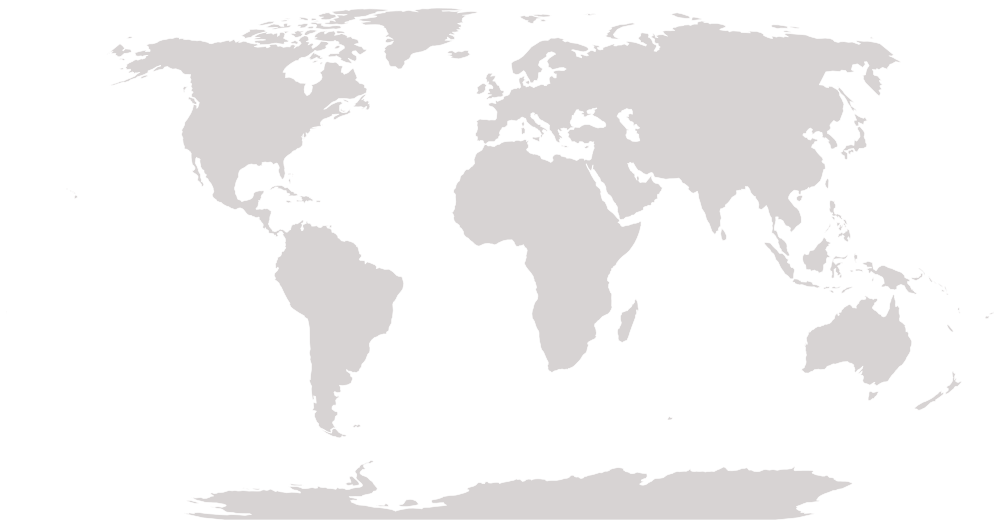
Hauptstadt: Jerusalem
Israel: unter den Top 10 der Welt bei Essen & Landwirtschaft
Israel gehört bei diesen Feldfrüchten, Tieren, Fischen, Meeresfrüchten und landwirtschaftlichen Erzeugnissen weltweit zu den Top 10 (neueste FAO-Daten).
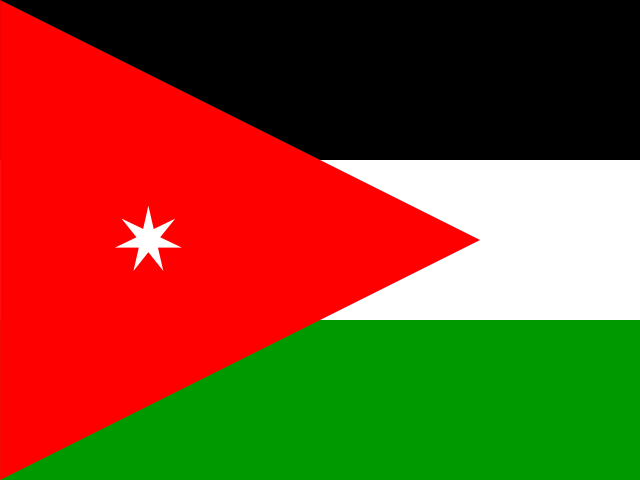
Nachbarländer an Land



Spitzenplätze
Israel gehört zu den Top 10 bei:
Israel in den Weltranglisten
So schneidet Israel im Vergleich mit anderen Ländern ab, Kennzahl für Kennzahl. Eine Kennzahl anklicken, um die ganze Rangliste zu sehen.
| Kennzahl | Wert | Jahr | Platz |
|---|---|---|---|
| Geografie & Natur | |||
| Gesamtfläche | 22.070 km² | 2024 | Platz 148 von 193 |
| Anzahl der Landgrenzen | 4 | Platz 56 von 193 gleichauf | |
| Breitengrad der Hauptstadt | 31,8° | Platz 72 von 193 | |
| Entfernung von Japan | 9.146 km | Platz 116 von 192 | |
| Waldfläche (Anteil an der Landfläche) | 6,8 % | 2024 | Platz 161 von 193 |
| Ackerland (Anteil an der Landfläche) | 11,9 % | 2024 | Platz 85 von 190 |
| Schutzgebiete an Land (Anteil an der Landfläche) | 27,6 % | 2025 | Platz 45 von 192 gleichauf |
| Landwirtschaftsfläche (Anteil an der Landfläche) | 23,8 % | 2024 | Platz 132 von 192 |
| Durchschnittlicher Jahresniederschlag | 435 mm | 2021 | Platz 148 von 180 |
| Süßwasservorkommen pro Kopf | 80 m³ | 2021 | Platz 172 von 181 |
| Waldfläche | 1.500 km² | 2025 | Platz 156 von 193 |
| Meeresschutzgebiete (Anteil an den Hoheitsgewässern) | 0,6 % | 2025 | Platz 105 von 153 gleichauf |
| Menschen & Bevölkerung | |||
| Einwohnerzahl | 10.122.800 | 2025 | Platz 95 von 193 |
| Bevölkerungsdichte | 462,2 Einwohner/km² | 2024 | Platz 18 von 193 |
| Bevölkerungswachstum | 1,20 % | 2025 | Platz 85 von 193 |
| Stadtbevölkerung (Anteil der Bevölkerung) | 91,6 % | 2025 | Platz 17 von 193 |
| Lebenserwartung | 83,2 Jahre | 2024 | Platz 13 von 193 |
| Fertilitätsrate (Kinder pro Frau) | 2,87 Geburten pro Frau | 2024 | Platz 57 von 193 |
| Säuglingssterblichkeit | 2,7 pro 1.000 Geburten | 2024 | Platz 171 von 192 gleichauf |
| Geburtenrate (pro 1.000 Einwohner) | 18,6 pro 1.000 Einwohner | 2024 | Platz 81 von 193 |
| Anteil der Menschen ab 65 Jahren | 12,7 % | 2025 | Platz 65 von 193 |
| Anteil der Kinder von 0 bis 14 Jahren | 27,2 % | 2025 | Platz 82 von 193 |
| Lebenserwartung der Frauen | 85,4 Jahre | 2024 | Platz 14 von 193 gleichauf |
| Lebenserwartung der Männer | 81,1 Jahre | 2024 | Platz 17 von 193 gleichauf |
| Müttersterblichkeit | 2 pro 100.000 Geburten | 2023 | Platz 188 von 192 gleichauf |
| Stadtbewohner in der größten Stadt (Anteil) | 49,3 % | 2025 | Platz 18 von 149 |
| Sterberate (pro 1.000 Einwohner) | 5,3 pro 1.000 Einwohner | 2024 | Platz 164 von 193 |
| Sterblichkeit von Kindern unter 5 Jahren (pro 1.000 Geburten) | 3,3 pro 1.000 Geburten | 2024 | Platz 170 von 192 gleichauf |
| Bevölkerung im Alter von 15 bis 64 Jahren (Anteil der Bevölkerung) | 60,1 % | 2025 | Platz 142 von 193 |
| Wirtschaft | |||
| Bruttoinlandsprodukt (BIP) insgesamt | 611 Mrd. $ | 2025 | Platz 26 von 189 |
| BIP pro Kopf | 60.337 $ | 2025 | Platz 18 von 189 |
| BIP pro Kopf (Kaufkraftparität) | 59.717 $ | 2025 | Platz 33 von 185 |
| Wirtschaftswachstum | 2,9 % | 2025 | Platz 104 von 188 |
| Inflationsrate | 3,0 % | 2025 | Platz 92 von 179 |
| Arbeitslosenquote | 3,5 % | 2025 | Platz 124 von 178 |
| Exporte (Anteil am BIP) | 27,6 % | 2025 | Platz 108 von 168 |
| Importe (Anteil am BIP) | 25,4 % | 2025 | Platz 137 von 168 |
| Landwirtschaft (Anteil am BIP) | 1,3 % | 2024 | Platz 159 von 184 |
| Industrie (Anteil am BIP) | 17,2 % | 2024 | Platz 143 von 185 |
| Dienstleistungen (Anteil am BIP) | 72,8 % | 2024 | Platz 15 von 185 |
| Militärausgaben (Anteil am BIP) | 7,8 % | 2025 | Platz 3 von 155 |
| Einkommensungleichheit (Gini-Koeffizient) | 38,3 (0–100) | 2022 | Platz 50 von 149 |
| Warenexporte (insgesamt) | 59 Mrd. $ | 2025 | Platz 50 von 190 |
| Überweisungen von Arbeitskräften im Ausland (Anteil am BIP) | 0,2 % | 2025 | Platz 148 von 170 |
| Frauen im Erwerbsleben (Anteil der Frauen) | 62,3 % | 2025 | Platz 33 von 178 |
| Jugendarbeitslosigkeit | 6,0 % | 2025 | Platz 145 von 178 |
| Getreideproduktion | 175.077 t | 2024 | Platz 133 von 177 |
| Getreideertrag (pro Hektar Anbaufläche) | 2.619 kg/ha | 2024 | Platz 100 von 175 |
| Fisch- und Meeresfrüchteproduktion (Fang + Zucht) | 16.915 t | 2024 | Platz 141 von 193 |
| Fischfang (aus Meer, Flüssen und Seen) | 2.065 t | 2024 | Platz 160 von 193 |
| Aquakultur (gezüchtete Fische und Meeresfrüchte) | 14.850 t | 2024 | Platz 74 von 193 |
| Wachstum der Tierproduktion (2014–16 = 100) | 111,7 (Durchschnitt 2014–16 = 100) | 2024 | Platz 84 von 187 |
| Düngemitteleinsatz (pro Hektar Ackerland) | 247 kg/ha | 2024 | Platz 28 von 187 |
| Verarbeitendes Gewerbe (Anteil am BIP) | 11,2 % | 2024 | Platz 83 von 178 |
| Beschäftigung in der Landwirtschaft (Anteil der Beschäftigten) | 0,8 % | 2025 | Platz 177 von 178 |
| Hightech-Exporte (Anteil an den Exporten von Industriewaren) | 37,2 % | 2024 | Platz 11 von 168 |
| Ausländische Direktinvestitionen, Zuflüsse (Anteil am BIP) | 4,3 % | 2025 | Platz 44 von 187 |
| Erwerbspersonen (Anzahl) | 4.828.536 | 2025 | Platz 89 von 178 |
| Reserven an Devisen und Gold | 229 Mrd. $ | 2025 | Platz 18 von 169 |
| Extreme Armut (Anteil der Menschen mit weniger als 3,00 $ pro Tag) | 0,4 % | 2022 | Platz 92 von 132 gleichauf |
| Alltag & Technik | |||
| Internetnutzer (Anteil der Bevölkerung) | 88,2 % | 2024 | Platz 67 von 186 |
| Mobilfunkverträge | 177,4 pro 100 Einwohner | 2024 | Platz 10 von 193 |
| Zugang zu Strom (Anteil der Bevölkerung) | 100,0 % | 2024 | Platz 1 von 193 gleichauf |
| Gesundheitsausgaben (Anteil am BIP) | 7,1 % | 2023 | Platz 81 von 192 |
| Bildungsausgaben (Anteil am BIP) | 5,9 % | 2022 | Platz 29 von 179 |
| Krankenhausbetten | 3,1 pro 1.000 Einwohner | 2023 | Platz 57 von 157 |
| Ärztedichte | 3,80 pro 1.000 Einwohner | 2023 | Platz 36 von 188 |
| Forschungsausgaben (Anteil am BIP) | 6,35 % | 2023 | Platz 1 von 130 |
| Frauenanteil im Parlament | 24,2 % | 2025 | Platz 104 von 192 |
| Studierende an Universitäten und Hochschulen | 56,3 % | 2024 | Platz 66 von 163 |
| Festnetz-Breitbandanschlüsse | 29,2 pro 100 Einwohner | 2024 | Platz 56 von 192 |
| Beförderte Flugpassagiere | 7.377.778 | 2023 | Platz 51 von 152 |
| Sicheres Trinkwasser (Anteil der Bevölkerung) | 99,5 % | 2024 | Platz 22 von 136 |
| Sichere Sanitärversorgung (Anteil der Bevölkerung) | 97,2 % | 2024 | Platz 16 von 136 |
| Unterernährung (Anteil der Bevölkerung) | 2,5 % | 2024 | Platz 102 von 165 gleichauf |
| Saubere Brennstoffe zum Kochen (Anteil der Bevölkerung) | 100,0 % | 2024 | Platz 1 von 192 gleichauf |
| Verkehrstote | 3,9 pro 100.000 Einwohner | 2019 | Platz 167 von 183 gleichauf |
| Masernimpfung (Anteil der Kinder) | 98,0 % | 2024 | Platz 20 von 192 gleichauf |
| Besuch weiterführender Schulen (Bruttoquote) | 98,5 % | 2024 | Platz 63 von 180 |
| Abschlussquote der Grundschule | 97,0 % | 2024 | Platz 70 von 172 |
| Pflegekräfte und Hebammen (pro 1.000 Einwohner) | 5,90 pro 1.000 Einwohner | 2023 | Platz 61 von 190 |
| Tuberkulosefälle (pro 100.000 Einwohner) | 2 pro 100.000 Einwohner | 2024 | Platz 181 von 191 |
| Gesundheitsausgaben pro Kopf | 3.928 $ | 2023 | Platz 21 von 192 |
| Containerumschlag in Häfen (TEU) | 3.059.136 TEU | 2024 | Platz 42 von 150 |
| Umwelt | |||
| Strom aus erneuerbaren Energien (Anteil der Stromerzeugung) | 7,6 % | 2021 | Platz 138 von 187 |
| CO₂-Emissionen pro Kopf | 5,8 t CO₂-Äquivalent pro Kopf | 2024 | Platz 41 von 186 |
| CO₂-Emissionen (insgesamt) | 57,7 Mt CO₂-Äquivalent | 2024 | Platz 54 von 186 |
| Luftverschmutzung (Feinstaub PM2,5) | 21,9 µg/m³ | 2023 | Platz 71 von 192 |
| Energieverbrauch pro Kopf | 2.443 kg Öläquivalent pro Kopf | 2024 | Platz 45 von 146 |
| Erneuerbare Energien (Anteil am Endenergieverbrauch) | 6,2 % | 2021 | Platz 155 von 191 |
| Stromverbrauch pro Kopf | 7.203 kWh pro Kopf | 2025 | Platz 22 von 146 |
| Strom aus Kernenergie (Anteil am gesamten Strom) | 0,0 % | 2021 | Platz 33 von 190 gleichauf |
| Strom aus Wasserkraft (Anteil am gesamten Strom) | 0,0 % | 2024 | Platz 150 von 190 gleichauf |
| Treibhausgasemissionen (insgesamt) | 76,6 Mt CO₂-Äquivalent | 2024 | Platz 61 von 186 |
| Süßwasserentnahme (Anteil an den inneren Ressourcen) | 204,0 % | 2021 | Platz 12 von 175 |
| Ernährung & Landwirtschaft | |||
| Weizen: Produktion | 90.350 t | 2024 | Platz 81 von 120 |
| Mais: Produktion | 43.671 t | 2024 | Platz 116 von 160 |
| Gerste: Produktion | 7.200 t | 2024 | Platz 88 von 100 |
| Sorghum: Produktion | 33.599 t | 2024 | Platz 56 von 107 |
| Hafer: Produktion | 257 t | 2024 | Platz 71 von 74 |
| Kartoffeln: Produktion | 475.010 t | 2024 | Platz 67 von 150 |
| Süßkartoffeln: Produktion | 17.426 t | 2024 | Platz 63 von 105 |
| Erdnüsse: Produktion | 13.500 t | 2024 | Platz 60 von 108 |
| Kichererbsen: Produktion | 5.670 t | 2024 | Platz 25 von 47 |
| Linsen: Produktion | 25 t | 2024 | Platz 41 von 43 |
| Trockenerbsen: Produktion | 2.245 t | 2024 | Platz 68 von 95 |
| Sonnenblumenkerne: Produktion | 2.800 t | 2024 | Platz 62 von 73 |
| Tomaten: Produktion | 315.895 t | 2024 | Platz 56 von 164 |
| Zwiebeln: Produktion | 65.397 t | 2024 | Platz 79 von 139 |
| Kohl: Produktion | 52.160 t | 2024 | Platz 71 von 143 |
| Karotten (mit Speiserüben): Produktion | 130.848 t | 2024 | Platz 40 von 129 |
| Gurken (mit Cornichons): Produktion | 82.848 t | 2024 | Platz 44 von 130 |
| Salat (mit Chicorée): Produktion | 11.882 t | 2024 | Platz 55 von 102 |
| Blumenkohl (mit Brokkoli): Produktion | 24.480 t | 2024 | Platz 38 von 95 |
| Auberginen: Produktion | 42.849 t | 2024 | Platz 39 von 94 |
| Grüne Chilis und Paprika: Produktion | 113.052 t | 2024 | Platz 38 von 124 |
| Pilze (mit Trüffeln): Produktion | 17.000 t | 2024 | Platz 25 von 63 |
| Knoblauch: Produktion | 417 t | 2024 | Platz 88 von 102 |
| Orangen: Produktion | 96.841 t | 2024 | Platz 46 von 112 |
| Mandarinen: Produktion | 138.089 t | 2024 | Platz 28 von 70 |
| Zitronen (mit Limetten): Produktion | 63.753 t | 2024 | Platz 32 von 101 |
| Äpfel: Produktion | 80.006 t | 2024 | Platz 54 von 92 |
| Bananen: Produktion | 197.001 t | 2024 | Platz 51 von 113 |
| Weintrauben: Produktion | 56.007 t | 2024 | Platz 57 von 91 |
| Mangos (mit Guaven und Mangostanen): Produktion | 62.559 t | 2024 | Platz 44 von 96 |
| Ananas: Produktion | 6.111 t | 2024 | Platz 57 von 82 |
| Erdbeeren: Produktion | 21.603 t | 2024 | Platz 31 von 80 |
| Wassermelonen: Produktion | 92.684 t | 2024 | Platz 63 von 119 |
| Pfirsiche (mit Nektarinen): Produktion | 60.002 t | 2024 | Platz 31 von 79 |
| Avocados: Produktion | 246.971 t | 2024 | Platz 8 von 70 |
| Datteln: Produktion | 80.000 t | 2024 | Platz 15 von 36 |
| Oliven: Produktion | 29.000 t | 2024 | Platz 24 von 40 |
| Melonen (Cantaloupe-Melonen und andere): Produktion | 25.126 t | 2024 | Platz 54 von 95 |
| Birnen: Produktion | 34.006 t | 2024 | Platz 34 von 85 |
| Pflaumen (mit Schlehen): Produktion | 16.005 t | 2024 | Platz 45 von 87 |
| Aprikosen: Produktion | 5.002 t | 2024 | Platz 41 von 65 |
| Kirschen: Produktion | 4.003 t | 2024 | Platz 47 von 65 |
| Papayas: Produktion | 1.759 t | 2024 | Platz 52 von 68 |
| Grapefruits (mit Pomelos): Produktion | 147.311 t | 2024 | Platz 9 von 71 |
| Mandeln: Produktion | 9.005 t | 2024 | Platz 22 von 48 |
| Baumwolle (Faser): Produktion | 14.040 t | 2023 | Platz 41 von 85 |
| Tabak: Produktion | 4 t | 2024 | Platz 116 von 117 |
| Rindfleisch: Produktion | 120.244 t | 2024 | Platz 64 von 181 |
| Schweinefleisch: Produktion | 11.122 t | 2024 | Platz 97 von 164 |
| Hühnerfleisch: Produktion | 600.072 t | 2024 | Platz 35 von 183 |
| Kuhmilch: Produktion | 1.647.010 t | 2024 | Platz 61 von 178 |
| Hühnereier: Produktion | 173.727 t | 2024 | Platz 43 von 167 |
| Honig: Produktion | 3.800 t | 2024 | Platz 56 von 122 |
| Schaffleisch (Hammel und Lamm): Produktion | 30.543 t | 2024 | Platz 50 von 172 |
| Ziegenfleisch: Produktion | 3.332 t | 2024 | Platz 82 von 164 |
| Ziegenmilch: Produktion | 19.423 t | 2024 | Platz 64 von 108 |
| Butter (mit Ghee): Produktion | 6.730 t | 2023 | Platz 65 von 124 |
| Käse (alle Sorten): Produktion | 151.723 t | 2023 | Platz 29 von 105 |
| Riesen-Süßwassergarnelen: Produktion | 30 t | 2024 | Platz 14 von 30 |
| Graskarpfen: Produktion | 160 t | 2024 | Platz 27 von 47 |
| Silberkarpfen: Produktion | 240 t | 2024 | Platz 25 von 46 |
| Karpfen: Produktion | 2.170 t | 2024 | Platz 34 von 97 |
| Barramundis (Riesenbarsche): Produktion | 1.100 t | 2024 | Platz 10 von 20 |
| Regenbogenforellen: Produktion | 410 t | 2024 | Platz 55 von 79 |
| Goldbrassen (Doraden): Produktion | 2.150 t | 2024 | Platz 16 von 31 |
| Wolfsbarsche: Produktion | 55 t | 2024 | Platz 19 von 29 |
| Atlantische Rote Thunfische: Produktion | 10 t | 2024 | Platz 27 von 32 |
| Garnelen: Produktion | 10 t | 2024 | Platz 108 von 114 |
| Flusskrebse und andere Süßwasser-Krebstiere: Produktion | 30 t | 2024 | Platz 36 von 64 |
| Kalmare, Sepien und Kraken: Produktion | 175 t | 2024 | Platz 66 von 102 |
| Thunfische, Bonitos und Schwertfischartige: Produktion | 90 t | 2024 | Platz 119 von 133 |
| Karpfen und andere Karpfenfische: Produktion | 2.720 t | 2024 | Platz 53 von 115 |
| Tilapien und andere Buntbarsche: Produktion | 5.885 t | 2024 | Platz 47 von 119 |
| Heringe, Sardinen und Sardellen: Produktion | 40 t | 2024 | Platz 96 von 108 gleichauf |
| Rinder: Anzahl der Tiere | 477.958 Tiere | 2024 | Platz 125 von 183 |
| Schweine: Anzahl der Tiere | 135.796 Tiere | 2024 | Platz 106 von 165 |
| Hühner: Anzahl der Tiere | 48.824.000 Vögel | 2024 | Platz 61 von 181 |
| Schafe: Anzahl der Tiere | 400.000 Tiere | 2024 | Platz 106 von 173 |
| Ziegen: Anzahl der Tiere | 109.307 Tiere | 2024 | Platz 120 von 180 |
| Pferde: Anzahl der Tiere | 4.000 Tiere | 2024 | Platz 109 von 143 |
| Kamele: Anzahl der Tiere | 5.642 Tiere | 2024 | Platz 36 von 46 |
| Esel: Anzahl der Tiere | 5.000 Tiere | 2024 | Platz 77 von 104 |
| Enten: Anzahl der Tiere | 180.000 Vögel | 2024 | Platz 49 von 80 |
| Puten: Anzahl der Tiere | 3.537.000 Vögel | 2024 | Platz 13 von 71 |
Fragen zu Israel
Was ist die Hauptstadt von Israel?
Die Hauptstadt von Israel ist Jerusalem.
Wie viele Einwohner hat Israel?
Die Einwohnerzahl von Israel beträgt etwa 10,1 Mio. (2025). Im Weltvergleich: Platz 95 von 193.
Wie groß ist Israel?
Die Fläche von Israel beträgt etwa 22.070 km². Im Weltvergleich: Platz 148 von 193.
Auf welchem Kontinent liegt Israel?
Israel liegt in Asien, in der Region Westasien.
Welche Währung und welche Sprachen gibt es in Israel?
Währung: Israelischer Neuer Schekel. Hauptsprachen: Hebräisch.
Wie groß ist Israel im Vergleich zu Japan, und wie viele Menschen leben dort?
Die Fläche von Israel beträgt etwa 1/17 von Japan, die Bevölkerung etwa 1/12 von Japan.
Wie weit ist Israel von Japan entfernt?
Die Hauptstadt Jerusalem liegt etwa 9.146 km Luftlinie von Tokio, der Hauptstadt Japans, entfernt.
Wie groß ist der Zeitunterschied zwischen Israel und Japan?
Die Hauptstadt Jerusalem liegt in der Normalzeit bei UTC+2: 7 Std. früher als in Japan. Während der Sommerzeit ändert sich der Unterschied um eine Stunde.
Weitere Länder in Westasien








Mit Israel spielen
Im Quiz testen, was Sie gelernt haben.