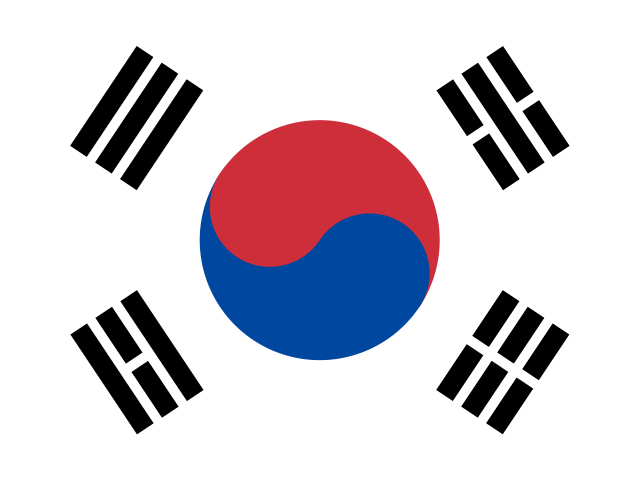
Flagge von Südkorea

Südkorea: Hauptstadt, Einwohner, Fläche und Flagge

Südkorea ist ein Land in Ostasien (Asien). Die Hauptstadt ist Seoul. Die Einwohnerzahl beträgt etwa 51,7 Mio. (Platz 29 von 193), die Fläche etwa 100.460 km² (Platz 107 von 193).

Wichtige Fakten

Hauptstadt
Seoul
Region
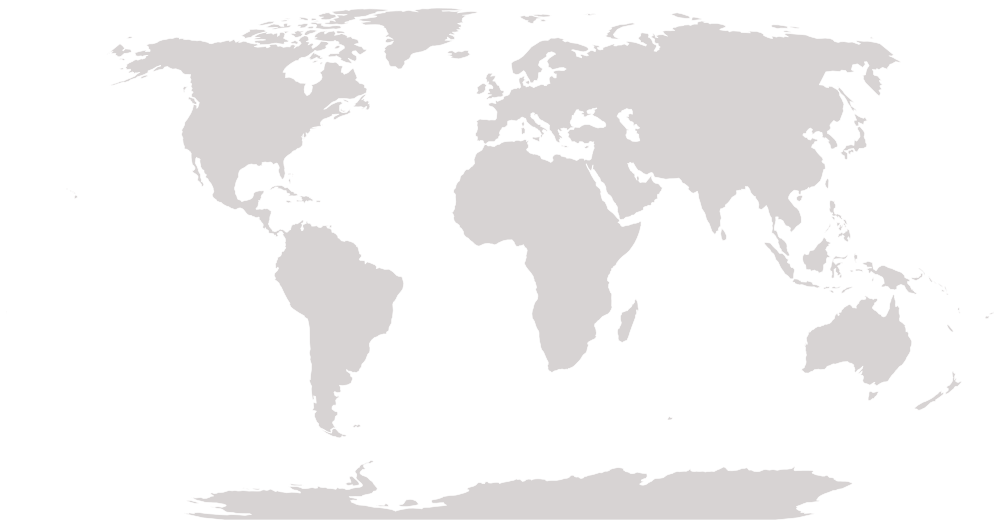
Asien / Ostasien
Einwohnerzahl
51.684.564 (2025) Platz 29 von 193
Gesamtfläche
100.460 km² (2024) Platz 107 von 193
Bevölkerungsdichte
530,2 Einwohner/km² (2024) Platz 15 von 193
Bruttoinlandsprodukt (BIP) insgesamt
1,87 Bio. $ (2025) Platz 13 von 189
BIP pro Kopf
36.227 $ (2025) Platz 33 von 189
Lebenserwartung
83,6 Jahre (2024) Platz 11 von 193
Entfernung von Japan
1.151 km Platz 192 von 192
Fläche im Vergleich zu Japan
etwa 1/4 von Japan
Bevölkerung im Vergleich zu Japan
etwa 1/2 von Japan
Hauptsprachen
Koreanisch
Währung
Südkoreanischer Won (KRW)
Landesvorwahl
+82
Zeitzone (Hauptstadt)
UTC+9
Zeitunterschied zu Japan (Normalzeit)
Gleiche Zeit wie in Japan
Fahrtrichtung
Rechtsverkehr
Lage der Hauptstadt
37.56°N 126.99°E

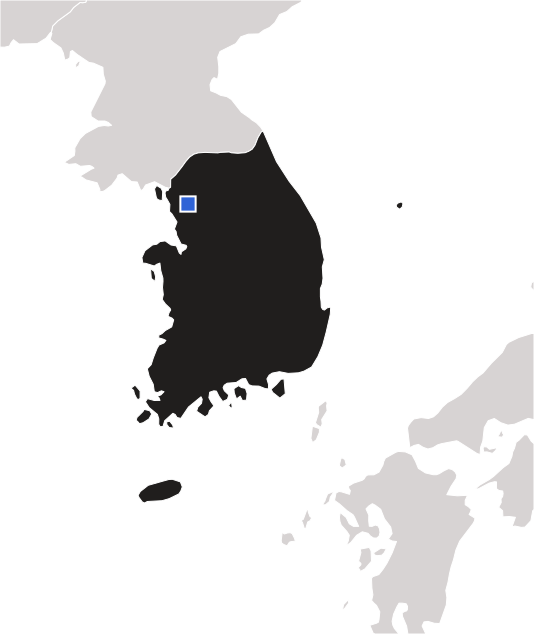
Karte von Südkorea

Karte von Südkorea

Hauptstadt: Seoul

Südkorea: Nummer eins der Welt

Südkorea liegt bei diesen Feldfrüchten, Tieren, Fischen, Meeresfrüchten und landwirtschaftlichen Erzeugnissen weltweit auf Platz 1 (neueste FAO-Daten). Eines davon auswählen, um die ganze Rangliste zu sehen.

Südkorea: unter den Top 10 der Welt bei Essen & Landwirtschaft

Südkorea gehört bei diesen Feldfrüchten, Tieren, Fischen, Meeresfrüchten und landwirtschaftlichen Erzeugnissen weltweit zu den Top 10 (neueste FAO-Daten).

Nachbarländer an Land

Spitzenplätze

Südkorea gehört zu den Top 10 bei:

Südkorea in den Weltranglisten

So schneidet Südkorea im Vergleich mit anderen Ländern ab, Kennzahl für Kennzahl. Eine Kennzahl anklicken, um die ganze Rangliste zu sehen.

KennzahlWertJahrPlatz
Geografie & Natur
Gesamtfläche100.460 km²2024Platz 107 von 193
Anzahl der Landgrenzen1Platz 138 von 193 gleichauf
Breitengrad der Hauptstadt37,6°Platz 57 von 193
Entfernung von Japan1.151 kmPlatz 192 von 192
Waldfläche (Anteil an der Landfläche)64,4 %2024Platz 21 von 193
Ackerland (Anteil an der Landfläche)13,3 %2024Platz 78 von 190
Schutzgebiete an Land (Anteil an der Landfläche)17,7 %2025Platz 96 von 192
Landwirtschaftsfläche (Anteil an der Landfläche)16,0 %2024Platz 158 von 192
Durchschnittlicher Jahresniederschlag1.274 mm2022Platz 71 von 180 gleichauf
Süßwasservorkommen pro Kopf1.255 m³2022Platz 119 von 181
Waldfläche62.791 km²2025Platz 67 von 193
Meeresschutzgebiete (Anteil an den Hoheitsgewässern)2,3 %2025Platz 75 von 153 gleichauf
Menschen & Bevölkerung
Einwohnerzahl51.684.5642025Platz 29 von 193
Bevölkerungsdichte530,2 Einwohner/km²2024Platz 15 von 193
Bevölkerungswachstum-0,13 %2025Platz 166 von 193
Stadtbevölkerung (Anteil der Bevölkerung)81,2 %2025Platz 39 von 193
Lebenserwartung83,6 Jahre2024Platz 11 von 193
Fertilitätsrate (Kinder pro Frau)0,75 Geburten pro Frau2024Platz 193 von 193
Säuglingssterblichkeit2,3 pro 1.000 Geburten2024Platz 176 von 192 gleichauf
Geburtenrate (pro 1.000 Einwohner)4,7 pro 1.000 Einwohner2024Platz 192 von 193
Anteil der Menschen ab 65 Jahren20,3 %2025Platz 30 von 193
Anteil der Kinder von 0 bis 14 Jahren10,2 %2025Platz 193 von 193
Lebenserwartung der Frauen86,6 Jahre2024Platz 4 von 193
Lebenserwartung der Männer80,8 Jahre2024Platz 22 von 193
Müttersterblichkeit4 pro 100.000 Geburten2023Platz 171 von 192 gleichauf
Stadtbewohner in der größten Stadt (Anteil)23,9 %2025Platz 97 von 149
Sterberate (pro 1.000 Einwohner)7,0 pro 1.000 Einwohner2024Platz 108 von 193 gleichauf
Sterblichkeit von Kindern unter 5 Jahren (pro 1.000 Geburten)2,8 pro 1.000 Geburten2024Platz 174 von 192 gleichauf
Bevölkerung im Alter von 15 bis 64 Jahren (Anteil der Bevölkerung)69,5 %2025Platz 26 von 193
Wirtschaft
Bruttoinlandsprodukt (BIP) insgesamt1,87 Bio. $2025Platz 13 von 189
BIP pro Kopf36.227 $2025Platz 33 von 189
BIP pro Kopf (Kaufkraftparität)63.125 $2025Platz 29 von 185
Wirtschaftswachstum1,0 %2025Platz 158 von 188
Inflationsrate2,1 %2025Platz 120 von 179
Arbeitslosenquote2,7 %2025Platz 151 von 178
Exporte (Anteil am BIP)45,8 %2025Platz 54 von 168
Importe (Anteil am BIP)40,6 %2025Platz 88 von 168
Landwirtschaft (Anteil am BIP)1,5 %2025Platz 156 von 184
Industrie (Anteil am BIP)34,3 %2025Platz 35 von 185
Dienstleistungen (Anteil am BIP)57,2 %2025Platz 92 von 185
Militärausgaben (Anteil am BIP)2,6 %2025Platz 38 von 155
Einkommensungleichheit (Gini-Koeffizient)32,9 (0–100)2021Platz 95 von 149 gleichauf
Warenexporte (insgesamt)709 Mrd. $2025Platz 7 von 190
Überweisungen von Arbeitskräften im Ausland (Anteil am BIP)0,4 %2025Platz 138 von 170
Frauen im Erwerbsleben (Anteil der Frauen)56,8 %2025Platz 65 von 178
Jugendarbeitslosigkeit6,7 %2025Platz 140 von 178
Getreideproduktion4.984.351 t2024Platz 57 von 177
Getreideertrag (pro Hektar Anbaufläche)6.544 kg/ha2024Platz 21 von 175
Fisch- und Meeresfrüchteproduktion (Fang + Zucht)3.555.275 t2024Platz 13 von 193
Fischfang (aus Meer, Flüssen und Seen)1.273.391 t2024Platz 18 von 193
Aquakultur (gezüchtete Fische und Meeresfrüchte)2.281.884 t2024Platz 6 von 193
Wachstum der Tierproduktion (2014–16 = 100)113,5 (Durchschnitt 2014–16 = 100)2024Platz 80 von 187
Düngemitteleinsatz (pro Hektar Ackerland)286 kg/ha2024Platz 18 von 187
Verarbeitendes Gewerbe (Anteil am BIP)27,4 %2025Platz 6 von 178
Beschäftigung in der Landwirtschaft (Anteil der Beschäftigten)5,1 %2025Platz 131 von 178
Hightech-Exporte (Anteil an den Exporten von Industriewaren)36,3 %2024Platz 12 von 168
Ausländische Direktinvestitionen, Zuflüsse (Anteil am BIP)0,8 %2025Platz 137 von 187
Erwerbspersonen (Anzahl)29.865.5752025Platz 23 von 178
Reserven an Devisen und Gold437 Mrd. $2025Platz 9 von 169
Extreme Armut (Anteil der Menschen mit weniger als 3,00 $ pro Tag)0,1 %2021Platz 111 von 132 gleichauf
Alltag & Technik
Internetnutzer (Anteil der Bevölkerung)97,9 %2024Platz 13 von 186
Mobilfunkverträge172,5 pro 100 Einwohner2024Platz 15 von 193
Zugang zu Strom (Anteil der Bevölkerung)100,0 %2024Platz 1 von 193 gleichauf
Gesundheitsausgaben (Anteil am BIP)8,7 %2024Platz 49 von 192
Bildungsausgaben (Anteil am BIP)5,4 %2022Platz 40 von 179
Krankenhausbetten12,8 pro 1.000 Einwohner2022Platz 1 von 157
Ärztedichte2,61 pro 1.000 Einwohner2022Platz 74 von 188
Forschungsausgaben (Anteil am BIP)4,94 %2023Platz 3 von 130
Frauenanteil im Parlament20,3 %2025Platz 123 von 192
Studierende an Universitäten und Hochschulen111,9 %2024Platz 3 von 163
Festnetz-Breitbandanschlüsse47,8 pro 100 Einwohner2024Platz 5 von 192
Beförderte Flugpassagiere76.272.4542023Platz 16 von 152
Sicheres Trinkwasser (Anteil der Bevölkerung)99,3 %2024Platz 24 von 136
Sichere Sanitärversorgung (Anteil der Bevölkerung)99,3 %2024Platz 8 von 136
Unterernährung (Anteil der Bevölkerung)2,5 %2024Platz 102 von 165 gleichauf
Saubere Brennstoffe zum Kochen (Anteil der Bevölkerung)100,0 %2024Platz 1 von 192 gleichauf
Verkehrstote8,6 pro 100.000 Einwohner2019Platz 132 von 183
Masernimpfung (Anteil der Kinder)97,0 %2024Platz 31 von 192 gleichauf
Besuch weiterführender Schulen (Bruttoquote)96,3 %2024Platz 73 von 180
Abschlussquote der Grundschule102,9 %2024Platz 20 von 172
Pflegekräfte und Hebammen (pro 1.000 Einwohner)9,09 pro 1.000 Einwohner2022Platz 27 von 190
Tuberkulosefälle (pro 100.000 Einwohner)35 pro 100.000 Einwohner2024Platz 109 von 191
Gesundheitsausgaben pro Kopf3.137 $2024Platz 29 von 192
Containerumschlag in Häfen (TEU)31.850.924 TEU2024Platz 4 von 150
Umwelt
Strom aus erneuerbaren Energien (Anteil der Stromerzeugung)6,7 %2021Platz 143 von 187
CO₂-Emissionen pro Kopf11,4 t CO₂-Äquivalent pro Kopf2024Platz 15 von 186
CO₂-Emissionen (insgesamt)588,0 Mt CO₂-Äquivalent2024Platz 9 von 186
Luftverschmutzung (Feinstaub PM2,5)21,9 µg/m³2023Platz 72 von 192
Energieverbrauch pro Kopf5.564 kg Öläquivalent pro Kopf2024Platz 13 von 146
Erneuerbare Energien (Anteil am Endenergieverbrauch)3,6 %2021Platz 162 von 191
Stromverbrauch pro Kopf12.071 kWh pro Kopf2025Platz 10 von 146
Strom aus Kernenergie (Anteil am gesamten Strom)28,7 %2025Platz 12 von 190
Strom aus Wasserkraft (Anteil am gesamten Strom)1,3 %2025Platz 133 von 190
Treibhausgasemissionen (insgesamt)668,2 Mt CO₂-Äquivalent2024Platz 13 von 186
Süßwasserentnahme (Anteil an den inneren Ressourcen)45,0 %2022Platz 33 von 175
Ernährung & Landwirtschaft
Weizen: Produktion37.376 t2024Platz 89 von 120
Reis: Produktion4.783.114 t2024Platz 18 von 114
Mais: Produktion89.000 t2024Platz 104 von 160
Gerste: Produktion47.730 t2024Platz 72 von 100
Sorghum: Produktion2.932 t2024Platz 83 von 107
Hirse: Produktion1.000 t2024Platz 60 von 73 gleichauf
Roggen: Produktion3 t2024Platz 62 von 62
Kartoffeln: Produktion568.625 t2024Platz 58 von 150
Süßkartoffeln: Produktion314.426 t2024Platz 28 von 105
Sojabohnen: Produktion154.954 t2024Platz 36 von 101
Erdnüsse: Produktion10.000 t2024Platz 68 von 108
Raps: Produktion1.000 t2024Platz 60 von 63
Trockenbohnen: Produktion5.979 t2024Platz 76 von 105
Trockenerbsen: Produktion6 t2024Platz 95 von 95
Tomaten: Produktion319.941 t2024Platz 54 von 164
Zwiebeln: Produktion1.175.276 t2024Platz 20 von 139
Kohl: Produktion2.378.687 t2024Platz 4 von 143
Karotten (mit Speiserüben): Produktion80.837 t2024Platz 49 von 129
Gurken (mit Cornichons): Produktion288.552 t2024Platz 17 von 130
Salat (mit Chicorée): Produktion106.537 t2024Platz 19 von 102
Blumenkohl (mit Brokkoli): Produktion84 t2024Platz 92 von 95
Auberginen: Produktion4.940 t2024Platz 60 von 94
Grüne Chilis und Paprika: Produktion210.793 t2024Platz 21 von 124
Pilze (mit Trüffeln): Produktion23.436 t2024Platz 24 von 63
Knoblauch: Produktion284.936 t2024Platz 5 von 102
Mandarinen: Produktion640.229 t2024Platz 13 von 70
Äpfel: Produktion460.088 t2024Platz 27 von 92
Weintrauben: Produktion186.965 t2024Platz 39 von 91
Ananas: Produktion957 t2024Platz 72 von 82
Erdbeeren: Produktion169.267 t2024Platz 10 von 80
Wassermelonen: Produktion442.884 t2024Platz 27 von 119
Pfirsiche (mit Nektarinen): Produktion192.495 t2024Platz 15 von 79
Melonen (Cantaloupe-Melonen und andere): Produktion208.019 t2024Platz 20 von 95
Birnen: Produktion178.451 t2024Platz 13 von 85
Pflaumen (mit Schlehen): Produktion50.501 t2024Platz 26 von 87
Walnüsse: Produktion1.146 t2024Platz 43 von 55
Tee: Produktion18.400 t2024Platz 24 von 45 gleichauf
Tabak: Produktion27.948 t2024Platz 22 von 117
Ingwer: Produktion21.878 t2024Platz 15 von 40
Rindfleisch: Produktion370.000 t2024Platz 34 von 181
Schweinefleisch: Produktion1.455.000 t2024Platz 12 von 164
Hühnerfleisch: Produktion935.000 t2024Platz 30 von 183
Kuhmilch: Produktion1.766.401 t2024Platz 60 von 178
Hühnereier: Produktion807.142 t2024Platz 18 von 167
Honig: Produktion31.216 t2024Platz 17 von 122
Schaffleisch (Hammel und Lamm): Produktion5 t2024Platz 169 von 172
Ziegenfleisch: Produktion1.782 t2024Platz 93 von 164
Ziegenmilch: Produktion9.113 t2024Platz 79 von 108
Butter (mit Ghee): Produktion63.403 t2023Platz 26 von 124
Weißbeingarnelen (Vannamei-Garnelen): Produktion7.766 t2024Platz 20 von 54
Karpfen: Produktion771 t2024Platz 48 von 97
Regenbogenforellen: Produktion2.299 t2024Platz 30 von 79
Pazifische Austern: Produktion325.267 t2024Platz 1 von 30
Echte Bonitos (Skipjack): Produktion249.123 t2024Platz 3 von 82
Gelbflossen-Thunfische: Produktion56.745 t2024Platz 8 von 82
Großaugen-Thunfische: Produktion22.108 t2024Platz 4 von 68
Weiße Thunfische (Albacore): Produktion2.846 t2024Platz 12 von 60
Atlantische Rote Thunfische: Produktion268 t2024Platz 16 von 32
Schwertfische: Produktion836 t2024Platz 21 von 76
Haarschwänze (Degenfische): Produktion44.506 t2024Platz 2 von 44
Algen und andere Wasserpflanzen: Produktion1.728.356 t2024Platz 3 von 68
Garnelen: Produktion34.332 t2024Platz 23 von 114
Krabben: Produktion55.899 t2024Platz 8 von 97
Hummer und Langusten: Produktion1.474 t2024Platz 25 von 91
Flusskrebse und andere Süßwasser-Krebstiere: Produktion19 t2024Platz 39 von 64
Austern: Produktion325.267 t2024Platz 2 von 51
Venusmuscheln und Herzmuscheln: Produktion44.213 t2024Platz 7 von 55
Jakobsmuscheln: Produktion11.302 t2024Platz 10 von 31
Miesmuscheln: Produktion64.943 t2024Platz 5 von 52
Kalmare, Sepien und Kraken: Produktion114.470 t2024Platz 8 von 102
Thunfische, Bonitos und Schwertfischartige: Produktion387.219 t2024Platz 6 von 133
Karpfen und andere Karpfenfische: Produktion5.346 t2024Platz 44 von 115
Tilapien und andere Buntbarsche: Produktion189 t2024Platz 78 von 119
Heringe, Sardinen und Sardellen: Produktion189.337 t2024Platz 19 von 108
Dorsche, Seehechte und Schellfische: Produktion49.318 t2024Platz 20 von 65
Plattfische (Flundern, Heilbutte, Seezungen): Produktion75.396 t2024Platz 4 von 91
Süßwasseraale: Produktion16.013 t2024Platz 3 von 41
Seeigel, Seegurken und andere Stachelhäuter: Produktion3.339 t2024Platz 10 von 48
Haie und Rochen: Produktion10.821 t2024Platz 13 von 127
Rinder: Anzahl der Tiere3.889.278 Tiere2024Platz 61 von 183
Schweine: Anzahl der Tiere10.845.848 Tiere2024Platz 13 von 165
Hühner: Anzahl der Tiere178.474.000 Vögel2024Platz 29 von 181
Schafe: Anzahl der Tiere1.391 Tiere2024Platz 171 von 173
Ziegen: Anzahl der Tiere316.833 Tiere2024Platz 104 von 180
Pferde: Anzahl der Tiere27.329 Tiere2024Platz 85 von 143
Enten: Anzahl der Tiere7.158.000 Vögel2024Platz 18 von 80
Puten: Anzahl der Tiere8.000 Vögel2024Platz 66 von 71

Fragen zu Südkorea

Was ist die Hauptstadt von Südkorea?

Die Hauptstadt von Südkorea ist Seoul.

Wie viele Einwohner hat Südkorea?

Die Einwohnerzahl von Südkorea beträgt etwa 51,7 Mio. (2025). Im Weltvergleich: Platz 29 von 193.

Wie groß ist Südkorea?

Die Fläche von Südkorea beträgt etwa 100.460 km². Im Weltvergleich: Platz 107 von 193.

Auf welchem Kontinent liegt Südkorea?

Südkorea liegt in Asien, in der Region Ostasien.

Bei welchen Lebensmitteln und landwirtschaftlichen Erzeugnissen ist Südkorea weltweit die Nummer eins?

Südkorea liegt weltweit auf Platz 1 bei: Pazifische Austern 325.000 t (FAO-Daten).

Welche Währung und welche Sprachen gibt es in Südkorea?

Währung: Südkoreanischer Won. Hauptsprachen: Koreanisch.

Wie groß ist Südkorea im Vergleich zu Japan, und wie viele Menschen leben dort?

Die Fläche von Südkorea beträgt etwa 1/4 von Japan, die Bevölkerung etwa 1/2 von Japan.

Wie weit ist Südkorea von Japan entfernt?

Die Hauptstadt Seoul liegt etwa 1.151 km Luftlinie von Tokio, der Hauptstadt Japans, entfernt.

Wie groß ist der Zeitunterschied zwischen Südkorea und Japan?

Die Hauptstadt Seoul liegt in der Normalzeit bei UTC+9: Gleiche Zeit wie in Japan.

Weitere Länder in Ostasien
Mit Südkorea spielen

Im Quiz testen, was Sie gelernt haben.

Kartenpuzzle Quiz Ranglisten

Nach oben