
Saubere Brennstoffe zum Kochen (Anteil der Bevölkerung) im Zeitverlauf (2000–2024)
Verfolge Saubere Brennstoffe zum Kochen (Anteil der Bevölkerung) in den Ländern der Welt Jahr für Jahr von 2000 bis 2024.
- 2000: gemeinsamer Platz 1 (100,0 %; Anzahl der Länder: 5).
- 2024: gemeinsamer Platz 1 (100,0 %; Anzahl der Länder: 44).
- Japan, Saubere Brennstoffe zum Kochen (Anteil der Bevölkerung): von 97,0 % im Jahr 2000 auf 100,0 % im Jahr 2024 (+3 Prozentpunkte).
- Japan 2000: Platz 38 von 192. Japan 2024: Platz 1 von 192. Länder mit demselben Wert teilen sich denselben Platz.
Japan und Länder an der Spitze, in der Mitte und am Ende
| Land | 2000 | 2010 | 2020 | 2024 |
|---|---|---|---|---|
 Andorra | 99,0 % | 100,0 % | 100,0 % | 100,0 % |
 Japan | 97,0 % | 99,0 % | 99,0 % | 100,0 % |
 Zypern | 97,0 % | 98,0 % | 99,0 % | 99,0 % |
 Gabun | 67,0 % | 80,0 % | 91,0 % | 93,0 % |
 Myanmar | 2,0 % | 10,0 % | 38,0 % | 46,0 % |
 Südsudan | 1,0 % | 0,0 % | 0,0 % | 0,0 % |
| Länder mit Daten | 192 | 192 | 192 | 192 |
Rangliste und Karte für jedes Jahr
Wähle ein Jahr, um die führenden Länder dieses Jahres und die Weltkarte zu sehen. Die Farben teilen die Rangliste dieses Jahres in sieben Stufen ein.
| Platz | Land | Saubere Brennstoffe zum Kochen (Anteil der Bevölkerung) |
|---|
Größte Veränderungen, 2000–2024
Verglichen werden die Länder, für die sowohl 2000 als auch 2024 Daten vorliegen. Länder mit sehr kleinem Ausgangswert bleiben außen vor, weil ihre Verhältnisse übertrieben aussehen.
| Land | 2000 | 2024 | Veränderung | Platz |
|---|---|---|---|---|
 Indonesien | 6,0 % | 90,0 % | +84 Prozentpunkte | Platz 154 → Platz 105 |
 Vietnam | 15,0 % | 91,0 % | +76 Prozentpunkte | Platz 140 → Platz 102 |
 Tuvalu | 9,0 % | 84,0 % | +75 Prozentpunkte | Platz 147 → Platz 117 |
 Marshallinseln | 8,0 % | 80,0 % | +72 Prozentpunkte | Platz 150 → Platz 120 |
 Malediven | 33,0 % | 100,0 % | +67 Prozentpunkte | Platz 125 → Platz 1 |
| Land | 2000 | 2024 | Veränderung | Platz |
|---|---|---|---|---|
 Jemen | 54,0 % | 47,0 % | −7 Prozentpunkte | Platz 108 → Platz 141 |
 Venezuela | 98,0 % | 92,0 % | −6 Prozentpunkte | Platz 24 → Platz 100 |
 Sambia | 15,0 % | 10,0 % | −5 Prozentpunkte | Platz 140 → Platz 170 |
 Syrien | 97,0 % | 96,0 % | −1 Prozentpunkte | Platz 38 → Platz 76 |
| Südsudan | 1,0 % | 0,0 % | −1 Prozentpunkte | Platz 172 → Platz 191 |
Alle Länder in den wichtigen Jahren
Tabelle öffnen (Länder mit Daten)
| Land | 2000 | 2010 | 2020 | 2024 |
|---|---|---|---|---|
| Andorra | 99,0 % | 100,0 % | 100,0 % | 100,0 % |
 Argentinien | 97,0 % | 99,0 % | 100,0 % | 100,0 % |
 Australien | 98,0 % | 99,0 % | 100,0 % | 100,0 % |
 Barbados | 97,0 % | 99,0 % | 100,0 % | 100,0 % |
 Belgien | 98,0 % | 99,0 % | 100,0 % | 100,0 % |
 Bahrain | 99,0 % | 100,0 % | 100,0 % | 100,0 % |
 Brunei Darussalam | 99,0 % | 100,0 % | 100,0 % | 100,0 % |
 Bahamas | 100,0 % | 100,0 % | 100,0 % | 100,0 % |
 Belarus | 93,0 % | 99,0 % | 100,0 % | 100,0 % |
 Kanada | 98,0 % | 99,0 % | 100,0 % | 100,0 % |
 Schweiz | 99,0 % | 100,0 % | 100,0 % | 100,0 % |
 Deutschland | 98,0 % | 99,0 % | 100,0 % | 100,0 % |
 Dänemark | 99,0 % | 100,0 % | 100,0 % | 100,0 % |
 Algerien | 97,0 % | 99,0 % | 100,0 % | 100,0 % |
 Ägypten | 83,0 % | 99,0 % | 100,0 % | 100,0 % |
 Finnland | 97,0 % | 99,0 % | 99,0 % | 100,0 % |
 Frankreich | 98,0 % | 99,0 % | 100,0 % | 100,0 % |
 Vereinigtes Königreich | 98,0 % | 99,0 % | 99,0 % | 100,0 % |
 Griechenland | 98,0 % | 99,0 % | 100,0 % | 100,0 % |
 Irland | 98,0 % | 99,0 % | 100,0 % | 100,0 % |
 Israel | 97,0 % | 99,0 % | 99,0 % | 100,0 % |
 Island | 99,0 % | 100,0 % | 100,0 % | 100,0 % |
 Jordanien | 99,0 % | 100,0 % | 100,0 % | 100,0 % |
| Japan | 97,0 % | 99,0 % | 99,0 % | 100,0 % |
 Südkorea | 100,0 % | 100,0 % | 100,0 % | 100,0 % |
 Kuwait | 99,0 % | 100,0 % | 100,0 % | 100,0 % |
 Luxemburg | 100,0 % | 100,0 % | 100,0 % | 100,0 % |
 Monaco | 99,0 % | 100,0 % | 100,0 % | 100,0 % |
 Malta | 98,0 % | 99,0 % | 100,0 % | 100,0 % |
| Malediven | 33,0 % | 93,0 % | 100,0 % | 100,0 % |
 Malaysia | 98,0 % | 99,0 % | 99,0 % | 100,0 % |
 Niederlande | 99,0 % | 100,0 % | 100,0 % | 100,0 % |
 Norwegen | 99,0 % | 100,0 % | 100,0 % | 100,0 % |
 Oman | 99,0 % | 100,0 % | 100,0 % | 100,0 % |
 Katar | 99,0 % | 100,0 % | 100,0 % | 100,0 % |
 Russland | 100,0 % | 100,0 % | 100,0 % | 100,0 % |
 Saudi-Arabien | 99,0 % | 99,0 % | 100,0 % | 100,0 % |
 Schweden | 98,0 % | 99,0 % | 100,0 % | 100,0 % |
 Singapur | 100,0 % | 100,0 % | 100,0 % | 100,0 % |
 San Marino | 99,0 % | 100,0 % | 100,0 % | 100,0 % |
 Turkmenistan | 99,0 % | 100,0 % | 100,0 % | 100,0 % |
 Tunesien | 94,0 % | 99,0 % | 100,0 % | 100,0 % |
 Trinidad und Tobago | 98,0 % | 100,0 % | 100,0 % | 100,0 % |
 Vereinigte Staaten | 99,0 % | 99,0 % | 100,0 % | 100,0 % |
 Vereinigte Arabische Emirate | 99,0 % | 99,0 % | 99,0 % | 99,0 % |
 Antigua und Barbuda | 97,0 % | 98,0 % | 99,0 % | 99,0 % |
 Armenien | 79,0 % | 96,0 % | 99,0 % | 99,0 % |
 Aserbaidschan | 68,0 % | 95,0 % | 98,0 % | 99,0 % |
| Zypern | 97,0 % | 98,0 % | 99,0 % | 99,0 % |
 Tschechien | 96,0 % | 98,0 % | 99,0 % | 99,0 % |
 Ungarn | 92,0 % | 96,0 % | 98,0 % | 99,0 % |
 Irak | 68,0 % | 95,0 % | 99,0 % | 99,0 % |
 Iran | 88,0 % | 97,0 % | 99,0 % | 99,0 % |
 Italien | 98,0 % | 99,0 % | 99,0 % | 99,0 % |
 Litauen | 89,0 % | 95,0 % | 98,0 % | 99,0 % |
 Mauritius | 93,0 % | 97,0 % | 99,0 % | 99,0 % |
 Nauru | 86,0 % | 95,0 % | 98,0 % | 99,0 % |
 Neuseeland | 97,0 % | 99,0 % | 99,0 % | 99,0 % |
 Portugal | 95,0 % | 97,0 % | 98,0 % | 99,0 % |
 Seychellen | 94,0 % | 97,0 % | 99,0 % | 99,0 % |
 Slowakei | 97,0 % | 98,0 % | 99,0 % | 99,0 % |
 Uruguay | 93,0 % | 96,0 % | 99,0 % | 99,0 % |
 Bulgarien | 85,0 % | 93,0 % | 97,0 % | 98,0 % |
 Brasilien | 89,0 % | 94,0 % | 97,0 % | 98,0 % |
 St. Lucia | 88,0 % | 94,0 % | 97,0 % | 98,0 % |
 Republik Moldau | 64,0 % | 89,0 % | 97,0 % | 98,0 % |
 Polen | 89,0 % | 94,0 % | 98,0 % | 98,0 % |
 Slowenien | 92,0 % | 95,0 % | 98,0 % | 98,0 % |
 Türkei | 91,0 % | 93,0 % | 98,0 % | 98,0 % |
 St. Vincent und die Grenadinen | 96,0 % | 96,0 % | 97,0 % | 98,0 % |
 Costa Rica | 89,0 % | 92,0 % | 96,0 % | 97,0 % |
 Spanien | 45,0 % | 87,0 % | 96,0 % | 97,0 % |
 Kroatien | 85,0 % | 89,0 % | 95,0 % | 97,0 % |
 Marokko | 92,0 % | 95,0 % | 97,0 % | 97,0 % |
 Ukraine | 89,0 % | 94,0 % | 96,0 % | 97,0 % |
 Österreich | 91,0 % | 94,0 % | 95,0 % | 96,0 % |
 Chile | 87,0 % | 90,0 % | 94,0 % | 96,0 % |
 Kuba | 77,0 % | 89,0 % | 95,0 % | 96,0 % |
 Estland | 81,0 % | 89,0 % | 95,0 % | 96,0 % |
 Grenada | 91,0 % | 93,0 % | 96,0 % | 96,0 % |
 St. Kitts und Nevis | 84,0 % | 91,0 % | 95,0 % | 96,0 % |
 Kasachstan | 83,0 % | 91,0 % | 95,0 % | 96,0 % |
 Palau | 68,0 % | 91,0 % | 95,0 % | 96,0 % |
 Rumänien | 72,0 % | 84,0 % | 94,0 % | 96,0 % |
| Syrien | 97,0 % | 98,0 % | 96,0 % | 96,0 % |
 Ecuador | 90,0 % | 93,0 % | 95,0 % | 95,0 % |
 Georgien | 47,0 % | 65,0 % | 89,0 % | 95,0 % |
 Libyen | 94,0 % | 95,0 % | 95,0 % | 95,0 % |
 Suriname | 77,0 % | 88,0 % | 94,0 % | 95,0 % |
 El Salvador | 59,0 % | 76,0 % | 92,0 % | 95,0 % |
 Dominica | 81,0 % | 89,0 % | 92,0 % | 94,0 % |
 Panama | 81,0 % | 87,0 % | 93,0 % | 94,0 % |
 Usbekistan | 82,0 % | 87,0 % | 93,0 % | 94,0 % |
 Bhutan | 29,0 % | 64,0 % | 89,0 % | 93,0 % |
 Kolumbien | 79,0 % | 85,0 % | 91,0 % | 93,0 % |
 Dominikanische Republik | 85,0 % | 87,0 % | 92,0 % | 93,0 % |
| Gabun | 67,0 % | 80,0 % | 91,0 % | 93,0 % |
 Jamaika | 77,0 % | 85,0 % | 92,0 % | 93,0 % |
 Peru | 43,0 % | 66,0 % | 87,0 % | 93,0 % |
 Lettland | 85,0 % | 86,0 % | 91,0 % | 92,0 % |
| Venezuela | 98,0 % | 98,0 % | 93,0 % | 92,0 % |
 Bolivien | 64,0 % | 75,0 % | 88,0 % | 91,0 % |
 Tonga | 38,0 % | 57,0 % | 85,0 % | 91,0 % |
| Vietnam | 15,0 % | 47,0 % | 84,0 % | 91,0 % |
 China | 38,0 % | 58,0 % | 84,0 % | 90,0 % |
| Indonesien | 6,0 % | 42,0 % | 84,0 % | 90,0 % |
 Libanon | 78,0 % | 87,0 % | 91,0 % | 90,0 % |
 Südafrika | 57,0 % | 77,0 % | 88,0 % | 90,0 % |
 Albanien | 39,0 % | 65,0 % | 84,0 % | 89,0 % |
 Belize | 80,0 % | 82,0 % | 86,0 % | 89,0 % |
 Cabo Verde | 62,0 % | 70,0 % | 83,0 % | 89,0 % |
 Serbien | 62,0 % | 69,0 % | 82,0 % | 89,0 % |
 Mexiko | 84,0 % | 84,0 % | 86,0 % | 88,0 % |
 Thailand | 64,0 % | 72,0 % | 85,0 % | 88,0 % |
 Tadschikistan | 37,0 % | 66,0 % | 84,0 % | 88,0 % |
 Nordmazedonien | 60,0 % | 68,0 % | 82,0 % | 87,0 % |
| Tuvalu | 9,0 % | 43,0 % | 79,0 % | 84,0 % |
 Kirgisistan | 56,0 % | 70,0 % | 79,0 % | 82,0 % |
 Indien | 22,0 % | 34,0 % | 68,0 % | 81,0 % |
| Marshallinseln | 8,0 % | 58,0 % | 76,0 % | 80,0 % |
 Paraguay | 50,0 % | 56,0 % | 71,0 % | 76,0 % |
 Guyana | 35,0 % | 61,0 % | 81,0 % | 73,0 % |
 Montenegro | 67,0 % | 63,0 % | 67,0 % | 73,0 % |
 Botsuana | 45,0 % | 57,0 % | 67,0 % | 71,0 % |
 Bosnien und Herzegowina | 49,0 % | 49,0 % | 59,0 % | 65,0 % |
 Samoa | 18,0 % | 26,0 % | 50,0 % | 65,0 % |
 Philippinen | 38,0 % | 38,0 % | 57,0 % | 64,0 % |
 Nicaragua | 35,0 % | 43,0 % | 58,0 % | 63,0 % |
 Fidschi | 32,0 % | 31,0 % | 53,0 % | 61,0 % |
 Mongolei | 23,0 % | 34,0 % | 52,0 % | 59,0 % |
 Lesotho | 16,0 % | 31,0 % | 50,0 % | 58,0 % |
 Honduras | 30,0 % | 41,0 % | 52,0 % | 57,0 % |
 Kambodscha | 3,0 % | 11,0 % | 42,0 % | 57,0 % |
 Angola | 37,0 % | 45,0 % | 51,0 % | 56,0 % |
 Mauretanien | 30,0 % | 41,0 % | 51,0 % | 56,0 % |
 Eswatini | 26,0 % | 38,0 % | 51,0 % | 56,0 % |
 Guatemala | 40,0 % | 37,0 % | 45,0 % | 51,0 % |
 Pakistan | 24,0 % | 36,0 % | 48,0 % | 51,0 % |
 Äquatorialguinea | 10,0 % | 21,0 % | 46,0 % | 50,0 % |
 Côte d’Ivoire | 20,0 % | 18,0 % | 38,0 % | 48,0 % |
 Sudan | 8,0 % | 32,0 % | 51,0 % | 47,0 % |
| Jemen | 54,0 % | 61,0 % | 50,0 % | 47,0 % |
 Dschibuti | 4,0 % | 7,0 % | 31,0 % | 46,0 % |
| Myanmar | 2,0 % | 10,0 % | 38,0 % | 46,0 % |
 Namibia | 33,0 % | 40,0 % | 44,0 % | 46,0 % |
 Nepal | 6,0 % | 27,0 % | 40,0 % | 45,0 % |
 Republik Kongo | 12,0 % | 17,0 % | 32,0 % | 40,0 % |
 Senegal | 35,0 % | 32,0 % | 33,0 % | 39,0 % |
 Simbabwe | 32,0 % | 30,0 % | 34,0 % | 37,0 % |
 Mikronesien | 10,0 % | 13,0 % | 28,0 % | 35,0 % |
 Ghana | 7,0 % | 15,0 % | 28,0 % | 35,0 % |
 Kamerun | 10,0 % | 18,0 % | 28,0 % | 32,0 % |
 Kenia | 2,0 % | 8,0 % | 22,0 % | 32,0 % |
 Sri Lanka | 18,0 % | 21,0 % | 32,0 % | 31,0 % |
 Afghanistan | 7,0 % | 19,0 % | 31,0 % | 30,0 % |
 Bangladesch | 9,0 % | 12,0 % | 25,0 % | 29,0 % |
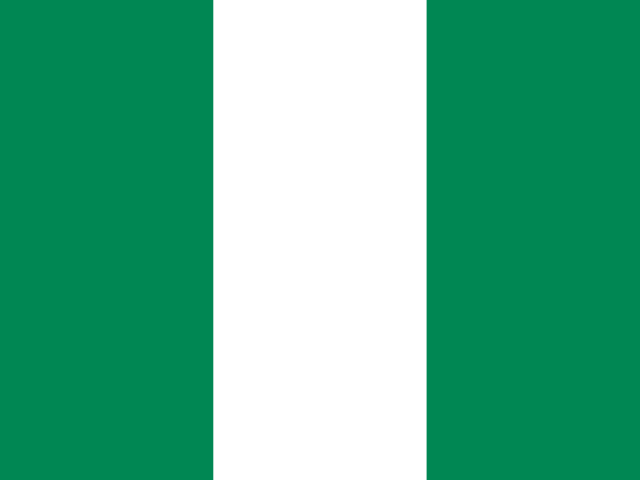 Nigeria | 1,0 % | 2,0 % | 19,0 % | 28,0 % |
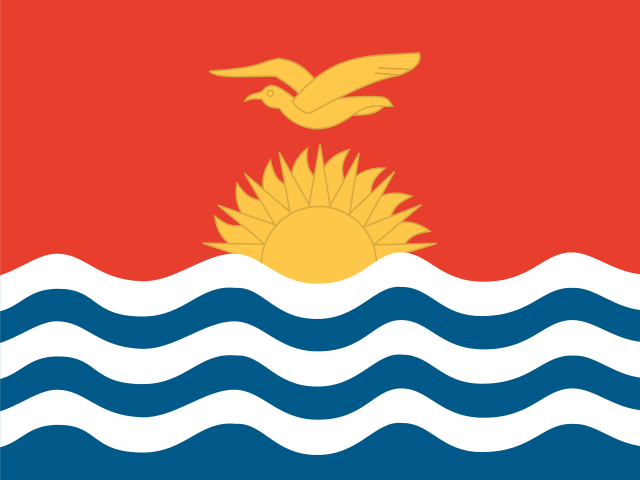 Kiribati | 2,0 % | 3,0 % | 14,0 % | 24,0 % |
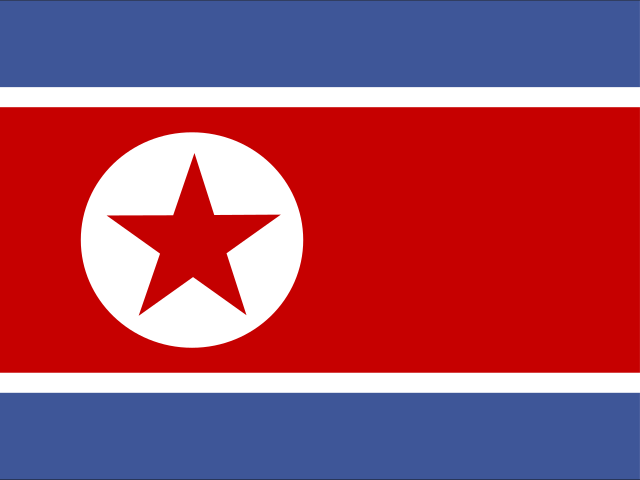 Nordkorea | 1,0 % | 6,0 % | 15,0 % | 22,0 % |
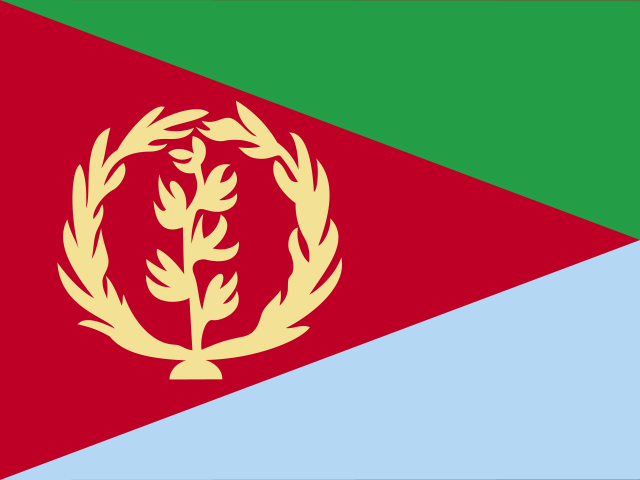 Eritrea | 4,0 % | 8,0 % | 18,0 % | 21,0 % |
 Vanuatu | 13,0 % | 13,0 % | 17,0 % | 20,0 % |
 Timor-Leste | 1,0 % | 5,0 % | 14,0 % | 19,0 % |
 Burkina Faso | 3,0 % | 6,0 % | 13,0 % | 18,0 % |
 Togo | 1,0 % | 3,0 % | 11,0 % | 15,0 % |
 Salomonen | 9,0 % | 8,0 % | 12,0 % | 14,0 % |
 Papua-Neuguinea | 5,0 % | 7,0 % | 10,0 % | 12,0 % |
 Komoren | 0,0 % | 3,0 % | 9,0 % | 11,0 % |
 Tschad | 2,0 % | 3,0 % | 7,0 % | 11,0 % |
 Tansania | 1,0 % | 1,0 % | 8,0 % | 11,0 % |
 Laos | 2,0 % | 3,0 % | 8,0 % | 10,0 % |
| Sambia | 15,0 % | 16,0 % | 10,0 % | 10,0 % |
 Ruanda | 0,0 % | 0,0 % | 4,0 % | 9,0 % |
 Benin | 1,0 % | 4,0 % | 6,0 % | 8,0 % |
 Mosambik | 2,0 % | 3,0 % | 6,0 % | 8,0 % |
 Äthiopien | 1,0 % | 2,0 % | 6,0 % | 7,0 % |
 São Tomé und Príncipe | 1,0 % | 1,0 % | 4,0 % | 7,0 % |
 Haiti | 3,0 % | 3,0 % | 5,0 % | 6,0 % |
 Niger | 1,0 % | 1,0 % | 4,0 % | 6,0 % |
 Demokratische Republik Kongo | 2,0 % | 3,0 % | 4,0 % | 5,0 % |
 Somalia | 0,0 % | 1,0 % | 4,0 % | 5,0 % |
 Gambia | 4,0 % | 3,0 % | 2,0 % | 3,0 % |
 Guinea | 1,0 % | 1,0 % | 1,0 % | 2,0 % |
 Guinea-Bissau | 2,0 % | 1,0 % | 2,0 % | 2,0 % |
 Madagaskar | 1,0 % | 1,0 % | 2,0 % | 2,0 % |
 Mali | 1,0 % | 1,0 % | 1,0 % | 2,0 % |
 Malawi | 2,0 % | 2,0 % | 2,0 % | 2,0 % |
 Sierra Leone | 0,0 % | 0,0 % | 1,0 % | 2,0 % |
 Uganda | 1,0 % | 1,0 % | 1,0 % | 2,0 % |
 Zentralafrikanische Republik | 1,0 % | 1,0 % | 1,0 % | 1,0 % |
 Liberia | 1,0 % | 0,0 % | 1,0 % | 1,0 % |
 Burundi | 0,0 % | 0,0 % | 0,0 % | 0,0 % |
| Südsudan | 1,0 % | 0,0 % | 0,0 % | 0,0 % |
| Länder mit Daten | 192 | 192 | 192 | 192 |
Hinweise zum Lesen dieses Verlaufs
Die Werte der einzelnen Jahre stammen aus demselben Indikator der Weltbank. Die Zahl der Länder mit Daten ist je nach Jahr verschieden, deshalb werden die Plätze eines Jahres nur unter den Ländern vergeben, die in diesem Jahr Daten haben. Die Ranglistenseite verwendet für jedes Land das neueste Jahr, daher kann sie von der Rangliste eines einzelnen Jahres hier abweichen.
Quelle: Access to clean fuels and technologies for cooking (% of population), Indikator EG.CFT.ACCS.ZS. Von dieser Website aufbereitet. data.worldbank.org
Daten der Weltbank zuletzt aktualisiert: 2026-10-08
Weitere Indikatoren im Zeitverlauf
- Aktuelle Rangliste: Saubere Brennstoffe zum Kochen (Anteil der Bevölkerung)
- Bruttoinlandsprodukt (BIP) insgesamt
- BIP pro Kopf
- Säuglingssterblichkeit
- Internetnutzer (Anteil der Bevölkerung)
- Zugang zu Strom (Anteil der Bevölkerung)
- CO₂-Emissionen pro Kopf
- CO₂-Emissionen (insgesamt)
- Stadtbevölkerung (Anteil der Bevölkerung)
- Warenexporte (insgesamt)
- Beförderte Flugpassagiere
- Frauen im Erwerbsleben (Anteil der Frauen)
- Frauenanteil im Parlament
- Masernimpfung (Anteil der Kinder)
- Strom aus erneuerbaren Energien (Anteil der Stromerzeugung)
- Luftverschmutzung (Feinstaub PM2,5)
- Gesundheitsausgaben (Anteil am BIP)
- Reis (Produktion)
- Weizen (Produktion)
- Mais (Produktion)
- Kartoffeln (Produktion)
- Tomaten (Produktion)
- Bananen (Produktion)
- Kuhmilch (Produktion)
- Hühnereier (Produktion)
- Hühnerfleisch (Produktion)
- Rindfleisch (Produktion)
- Schweinefleisch (Produktion)
- Sojabohnen (Produktion)
- Kaffee (Produktion)
- Kakaobohnen (Produktion)
- Zuckerrohr (Produktion)
- Maniok (Produktion)
- Orangen (Produktion)
- Äpfel (Produktion)
- Zwiebeln (Produktion)
- Rinder (Anzahl der Tiere)
- Schweine (Anzahl der Tiere)
- Schafe (Anzahl der Tiere)
- Hühner (Anzahl der Tiere)
- Gerste (Produktion)
- Sorghum (Produktion)
- Hirse (Produktion)
- Süßkartoffeln (Produktion)
- Erdnüsse (Produktion)
- Raps (Produktion)
- Sonnenblumenkerne (Produktion)
- Trockenbohnen (Produktion)
- Palmöl (Produktion)
- Weintrauben (Produktion)
- Mangos (mit Guaven und Mangostanen) (Produktion)
- Ananas (Produktion)
- Wassermelonen (Produktion)
- Zitronen (mit Limetten) (Produktion)
- Kohl (Produktion)
- Gurken (mit Cornichons) (Produktion)
- Tee (Produktion)
- Zuckerrüben (Produktion)
- Baumwolle (Faser) (Produktion)
- Honig (Produktion)
- Schaffleisch (Hammel und Lamm) (Produktion)
- Ziegenfleisch (Produktion)
- Ziegen (Anzahl der Tiere)
- Pferde (Anzahl der Tiere)
- Getreideproduktion
- Getreideertrag (pro Hektar Anbaufläche)
- Fisch- und Meeresfrüchteproduktion (Fang + Zucht)
- Fischfang (aus Meer, Flüssen und Seen)
- Aquakultur (gezüchtete Fische und Meeresfrüchte)
- Energieverbrauch pro Kopf
- Stromverbrauch pro Kopf
- Treibhausgasemissionen (insgesamt)
- Sicheres Trinkwasser (Anteil der Bevölkerung)
- Sichere Sanitärversorgung (Anteil der Bevölkerung)
- Erwerbspersonen (Anzahl)
- Beschäftigung in der Landwirtschaft (Anteil der Beschäftigten)
- Verarbeitendes Gewerbe (Anteil am BIP)
- Reserven an Devisen und Gold
- Überweisungen von Arbeitskräften im Ausland (Anteil am BIP)
- Tuberkulosefälle (pro 100.000 Einwohner)
- Gesundheitsausgaben pro Kopf