Flag of Bosnia & Herzegovina

Bosnia & Herzegovina: capital, population, area and flag

Bosnia & Herzegovina is a country in Southern Europe (Europe). Its capital is Sarajevo. The population is about 3.14M (#132 of 193) and the area is about 51,210 km² (#125 of 193).

Key facts

Capital
Sarajevo
Region
Europe / Southern Europe
Population
3,140,095 (2025) #132 of 193
Total area
51,210 km² (2023) #125 of 193
Population density
61.8 people/km² (2024) #123 of 193
GDP (total)
$32.6B (2025) #108 of 189
GDP per capita
$10,382 (2025) #83 of 189
Life expectancy
78.0 years (2024) #53 of 193
Distance from Japan
9,369 km #109 of 192
Area compared with Japan
about 1/7 that of Japan
Population compared with Japan
about 1/39 that of Japan
Main languages
Bosnian, Croatian, Serbian
Currency
Bosnia-Herzegovina Convertible Mark (BAM)
Calling code
+387
Time zone (capital)
UTC+1 (observes daylight saving time)
Time difference from Japan (standard time)
8 h behind Japan
Driving side
Right
Capital location
43.86°N 18.41°E

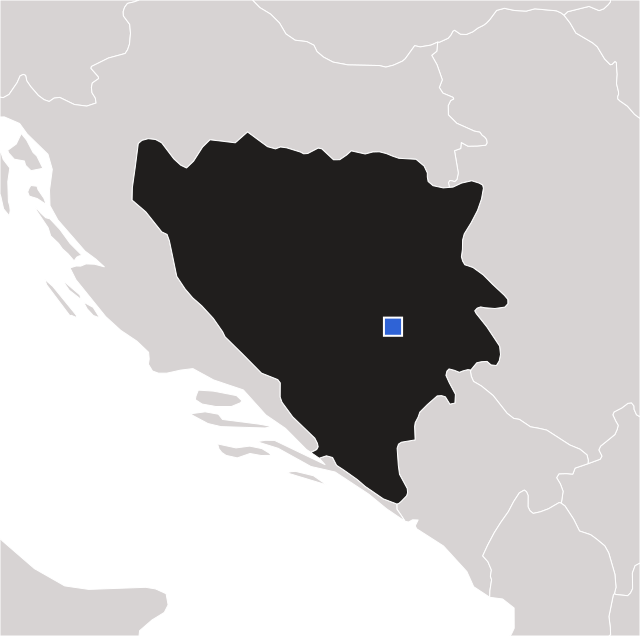
Map of Bosnia & Herzegovina

Map of Bosnia & Herzegovina

Capital: Sarajevo

Bosnia & Herzegovina: in the world’s top 10 for food & farming

Bosnia & Herzegovina ranks among the world’s top 10 for these crops, animals, seafood and farm products (latest FAO data).

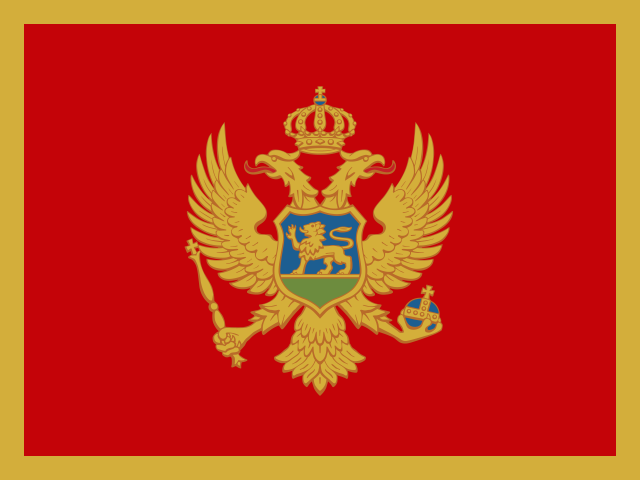
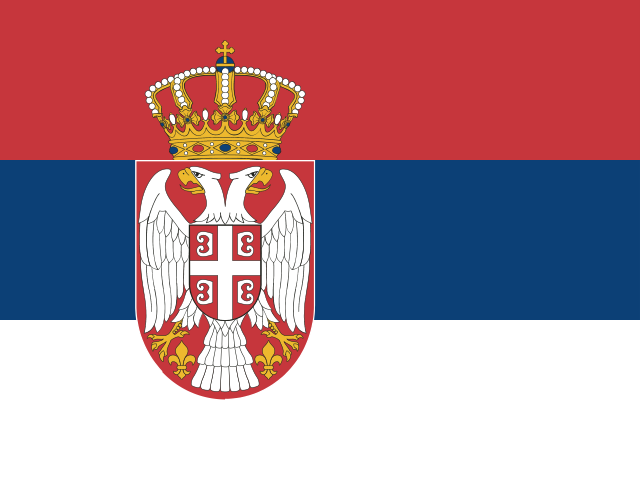
Neighbors by land
Top rankings

Bosnia & Herzegovina is in the top 10 for:

Bosnia & Herzegovina in world rankings

How Bosnia & Herzegovina compares with other countries, indicator by indicator. Click an indicator to see the full ranking.

IndicatorValueYearRank
Geography & nature
Total area51,210 km²2023#125 of 193
Number of land borders3#80 of 193 tied
Latitude of the capital43.9°#35 of 193
Distance from Japan9,369 km#109 of 192
Forest area (share of land)42.2%2024#63 of 193
Arable land (share of land)8.0%2024#111 of 190
Protected land (share of land)9.5%2025#145 of 192
Agricultural land (share of land)22.4%2024#139 of 192
Average annual rainfall1,028 mm2022#92 of 180
Freshwater resources per person11,077 m³2022#41 of 181
Forest area21,621 km²2025#105 of 193
Marine protected areas (share of territorial waters)0.0%2025#136 of 153 tied
People & population
Population3,140,0952025#132 of 193
Population density61.8 people/km²2024#123 of 193
Population growth rate-0.77%2025#188 of 193
Urban population (share of people)52.7%2025#129 of 193
Life expectancy78.0 years2024#53 of 193
Fertility rate1.49 births per woman2024#138 of 193
Infant mortality rate5.5 per 1,000 births2024#140 of 192 tied
Birth rate7.7 per 1,000 people2024#175 of 193
Share of people aged 65 and over22.9%2025#11 of 193
Share of children aged 0–1412.8%2025#185 of 193
Life expectancy of women81.1 years2024#54 of 193
Life expectancy of men74.6 years2024#63 of 193
Maternal mortality ratio6 per 100,000 births2023#160 of 192 tied
City dwellers living in the largest city (share)21.1%2025#109 of 149
Death rate (per 1,000 people)13.5 per 1,000 people2024#7 of 193
Under-5 mortality (per 1,000 births)6.9 per 1,000 births2024#139 of 192
Population aged 15–64 (share of population)64.3%2025#97 of 193
Economy
GDP (total)$32.6B2025#108 of 189
GDP per capita$10,3822025#83 of 189
GDP per capita (PPP)$25,8142025#79 of 185
Economic growth rate2.1%2025#129 of 188
Inflation rate4.0%2025#61 of 179
Unemployment rate11.0%2025#29 of 178
Exports (share of GDP)41.0%2025#68 of 168
Imports (share of GDP)54.1%2025#59 of 168
Agriculture (share of GDP)4.4%2025#108 of 184
Industry (share of GDP)21.5%2025#116 of 185
Services (share of GDP)57.7%2025#89 of 185
Military spending (share of GDP)0.7%2025#134 of 155
Income inequality (Gini index)30.3 (0–100)2021#116 of 149 tied
Goods exports (total)$9.81B2025#104 of 190
Money sent home by workers abroad (share of GDP)10.7%2025#23 of 170
Women in the labor force (share of women)39.2%2025#146 of 178
Youth unemployment rate28.2%2025#21 of 178
Cereal production1,202,745 t2024#101 of 177
Cereal yield (per hectare of farmland)5,362 kg/ha2024#33 of 175
Fish and seafood production (catch + farmed)5,237 t2024#163 of 193
Fish catch (from sea, rivers and lakes)305 t2024#179 of 193
Aquaculture (farmed fish and seafood)4,932 t2024#101 of 193
Livestock production growth (2014–16 = 100)78.3 (2014–16 average = 100)2024#180 of 187
Fertilizer use (per hectare of arable land)169 kg/ha2024#53 of 187
Manufacturing (share of GDP)12.0%2025#78 of 178
Employment in agriculture (share of jobs)16.7%2025#86 of 178
High-technology exports (share of manufactured exports)6.2%2024#86 of 168
Foreign direct investment, inflows (share of GDP)2.6%2025#74 of 187
Development aid received (share of national income)1.1%2023#87 of 132
Labor force (number of people)1,340,7072025#136 of 178
Reserves of foreign currency and gold$9.42B2024#82 of 169
Extreme poverty (share living on less than $3.00 a day)0.3%2021#101 of 132 tied
Daily life & technology
Internet users (share of people)86.1%2024#74 of 186
Mobile phone subscriptions121.2 per 100 people2024#80 of 193
Access to electricity (share of people)100.0%2024#1 of 193 tied
Health spending (share of GDP)8.9%2023#45 of 192
Education spending (share of GDP)3.2%2023#126 of 179
Hospital beds2.4 per 1,000 people2019#85 of 157
Doctors2.58 per 1,000 people2019#76 of 188
Research spending (share of GDP)0.21%2024#91 of 130
Women in parliament (share of seats)19.0%2025#131 of 192
University and college enrollment45.5%2023#87 of 163
Fixed broadband subscriptions29.4 per 100 people2024#55 of 192
Safe drinking water (share of people)86.4%2024#57 of 136
Undernourishment (share of people)2.5%2024#102 of 165 tied
Clean cooking fuels (share of people)65.0%2024#125 of 192 tied
Road traffic deaths13.5 per 100,000 people2019#103 of 183 tied
Measles vaccination (share of children)69.0%2024#170 of 192 tied
Secondary school enrollment (gross)87.9%2023#109 of 180
Primary school completion rate100.5%2023#28 of 172
Nurses and midwives (per 1,000 people)6.73 per 1,000 people2022#41 of 190
Tuberculosis cases (per 100,000 people)21 per 100,000 people2024#120 of 191 tied
Health spending per person$7732023#69 of 192
Environment
Renewable electricity (share of power)39.3%2021#74 of 187
CO₂ emissions per person6.4 t CO₂e per person2024#35 of 186
CO₂ emissions (total)20.4 Mt CO₂e2024#87 of 186
Air pollution (PM2.5)26.1 µg/m³2023#60 of 192
Energy use per person2,178 kg oil eq. per person2024#52 of 146
Renewable energy (share of final energy use)36.6%2021#65 of 191
Electricity consumption per person3,860 kWh per person2024#59 of 146
Electricity from nuclear power (share of total)0.0%2021#33 of 190 tied
Electricity from hydropower (share of total)32.0%2024#62 of 190
Greenhouse gas emissions (total)27.6 Mt CO₂e2024#110 of 186
Freshwater withdrawal (share of internal resources)0.9%2022#153 of 175
Food & farming
Wheat: production279,273 t2024#69 of 120
Maize (corn): production762,288 t2024#67 of 160
Barley: production77,697 t2024#63 of 100
Oats: production40,611 t2024#40 of 74
Rye: production5,669 t2024#38 of 62
Potatoes: production387,349 t2024#73 of 150
Soybeans: production31,579 t2024#55 of 101
Rapeseed (canola): production4,554 t2024#53 of 63
Dry beans: production11,485 t2024#67 of 105
Chickpeas: production5,410 t2024#27 of 47
Dry peas: production3,379 t2024#63 of 95
Sunflower seeds: production3,816 t2024#60 of 73
Tomatoes: production61,777 t2024#92 of 164
Onions: production46,048 t2024#86 of 139
Cabbages: production31,692 t2024#83 of 143
Carrots (with turnips): production15,010 t2024#85 of 129
Cucumbers (with gherkins): production36,216 t2024#63 of 130
Lettuce (with chicory): production2,583 t2024#66 of 102
Green chilies and sweet peppers: production57,162 t2024#50 of 124
Mushrooms (with truffles): production1,309 t2024#40 of 63
Garlic: production10,566 t2024#48 of 102
Oranges: production137 t2024#108 of 112
Tangerines (mandarins): production435 t2024#65 of 70
Lemons (with limes): production14 t2024#100 of 101
Apples: production191,900 t2024#44 of 92
Grapes: production29,681 t2024#63 of 91
Strawberries: production6,040 t2024#50 of 80
Watermelons: production14,455 t2024#87 of 119
Peaches (with nectarines): production32,061 t2024#41 of 79
Avocados: production1,037 t2024#58 of 70
Olives: production564 t2024#38 of 40
Pears: production84,830 t2024#21 of 85
Plums (with sloes): production321,200 t2024#7 of 87
Apricots: production4,662 t2024#44 of 65
Cherries: production37,790 t2024#14 of 65
Almonds: production36 t2024#46 of 48
Walnuts: production26,042 t2024#15 of 55
Sugar beet: production462 t2024#57 of 57
Tobacco: production377 t2024#96 of 117
Beef (cattle meat): production9,792 t2024#131 of 181
Pork (pig meat): production5,459 t2024#110 of 164
Chicken meat: production76,457 t2024#93 of 183
Cow’s milk: production600,487 t2024#84 of 178
Hen eggs: production22,059 t2024#102 of 167
Honey: production3,393 t2024#62 of 122
Sheep meat (mutton and lamb): production1,081 t2024#116 of 172
Butter (with ghee): production679 t2023#105 of 124
Cheese (all kinds): production9,153 t2023#81 of 105
Common carp: production261 t2024#61 of 97
Rainbow trout: production4,492 t2024#25 of 79
Gilthead seabream: production66 t2024#24 of 31
European seabass: production4 t2024#25 of 29
Mussels: production40 t2024#45 of 52
Carps and other cyprinids: production261 t2024#82 of 115
Cattle: number of animals383,331 animals2024#131 of 183
Pigs: number of animals447,474 animals2024#85 of 165
Chickens: number of animals11,523,000 birds2024#116 of 181
Sheep: number of animals1,098,899 animals2024#77 of 173
Goats: number of animals62,162 animals2024#131 of 180
Horses: number of animals5,380 animals2024#103 of 143
Ducks: number of animals54,000 birds2024#60 of 80
Turkeys: number of animals86,000 birds2024#55 of 71

Questions about Bosnia & Herzegovina

What is the capital of Bosnia & Herzegovina?

The capital of Bosnia & Herzegovina is Sarajevo.

What is the population of Bosnia & Herzegovina?

Bosnia & Herzegovina has a population of about 3.14M (2025), #132 of 193 among countries.

How big is Bosnia & Herzegovina?

Bosnia & Herzegovina covers about 51,210 km², #125 of 193 among countries.

Which continent is Bosnia & Herzegovina in?

Bosnia & Herzegovina is in Europe, in the region of Southern Europe.

What currency and languages are used in Bosnia & Herzegovina?

The currency is the Bosnia-Herzegovina Convertible Mark. Main languages: Bosnian, Croatian, Serbian.

How does Bosnia & Herzegovina compare with Japan in size and population?

The area of Bosnia & Herzegovina is about 1/7 that of Japan, and its population is about 1/39 that of Japan.

How far is Bosnia & Herzegovina from Japan?

The capital, Sarajevo, is about 9,369 km from Tokyo, the capital of Japan, in a straight line.

What is the time difference between Bosnia & Herzegovina and Japan?

The capital, Sarajevo, is on UTC+1 in standard time: 8 h behind Japan. The difference changes by one hour during daylight saving time.

More countries in Southern Europe
Play with Bosnia & Herzegovina

Test what you learned in the quiz.

Map puzzle Quiz Rankings

Back to top