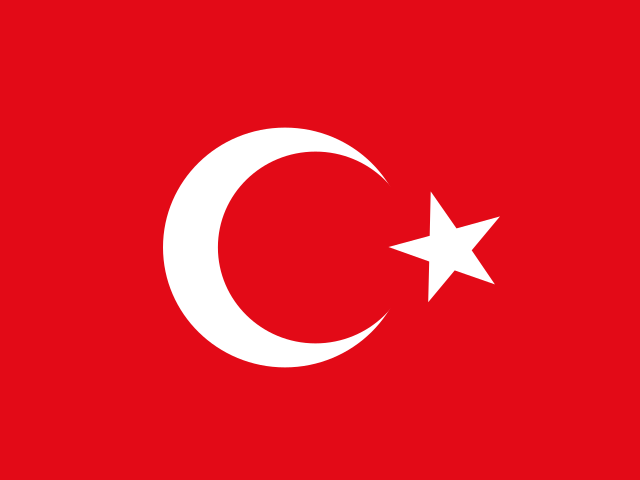
Flag of Türkiye

Türkiye: capital, population, area and flag

Türkiye is a country in Western Asia (Asia). Its capital is Ankara. The population is about 85.9M (#18 of 193) and the area is about 785,350 km² (#36 of 193).

Key facts

Capital
Ankara
Region
Asia / Western Asia
Population
85,878,556 (2025) #18 of 193
Total area
785,350 km² (2024) #36 of 193
Population density
111.1 people/km² (2024) #80 of 193
GDP (total)
$1.6T (2025) #16 of 189
GDP per capita
$18,599 (2025) #62 of 189
Life expectancy
77.4 years (2024) #65 of 193
Distance from Japan
8,764 km #128 of 192
Largest city
Istanbul
Area compared with Japan
about 2.1 times that of Japan
Population compared with Japan
about 0.7 times that of Japan
Main languages
Turkish
Currency
Turkish Lira (TRY)
Calling code
+90
Time zone (capital)
UTC+3
Time difference from Japan (standard time)
6 h behind Japan
Driving side
Right
Capital location
39.94°N 32.84°E

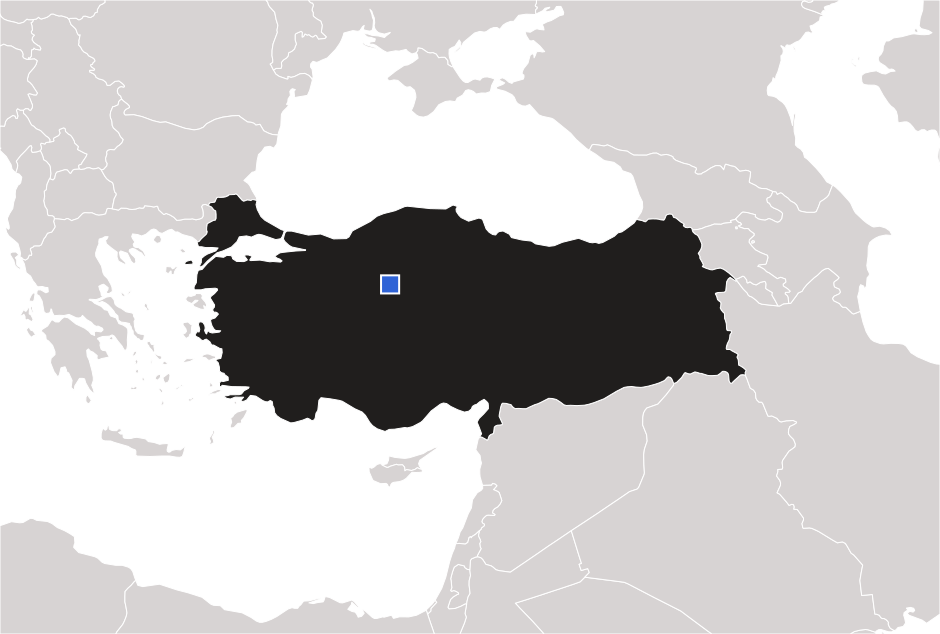
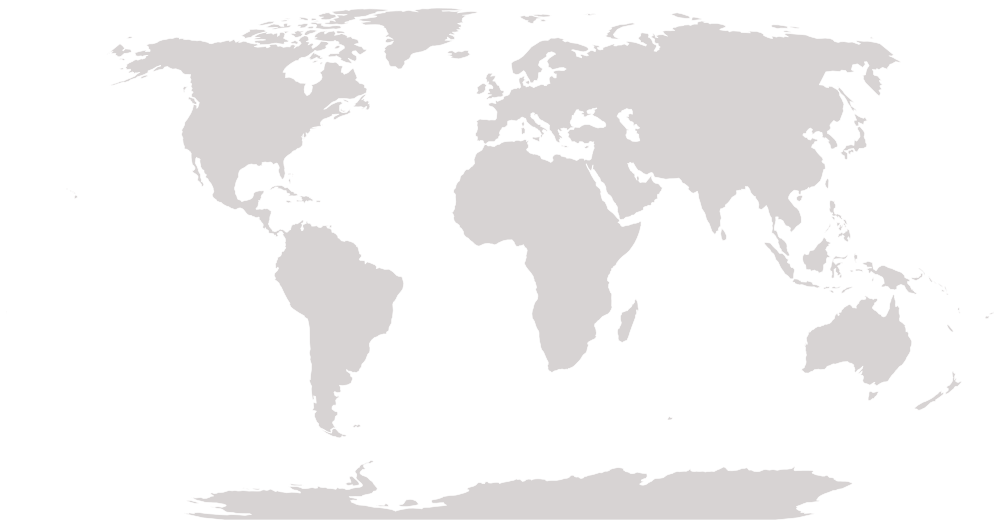
Map of Türkiye

Map of Türkiye

Capital: Ankara

Türkiye: number one in the world

Türkiye ranks first in the world for these crops, animals, seafood and farm products (latest FAO data). Select one to see the whole ranking.

Türkiye: in the world’s top 10 for food & farming

Türkiye ranks among the world’s top 10 for these crops, animals, seafood and farm products (latest FAO data).

Neighbors by land

Top rankings

Türkiye is in the top 10 for:

Türkiye in world rankings

How Türkiye compares with other countries, indicator by indicator. Click an indicator to see the full ranking.

IndicatorValueYearRank
Geography & nature
Total area785,350 km²2024#36 of 193
Number of land borders8#7 of 193 tied
Latitude of the capital39.9°#49 of 193
Distance from Japan8,764 km#128 of 192
Forest area (share of land)29.5%2024#104 of 193
Arable land (share of land)26.3%2024#36 of 190
Protected land (share of land)7.0%2025#161 of 192
Agricultural land (share of land)50.2%2024#56 of 192
Average annual rainfall593 mm2022#132 of 180
Freshwater resources per person2,671 m³2022#88 of 181
Forest area228,058 km²2025#28 of 193
Marine protected areas (share of territorial waters)1.7%2025#81 of 153 tied
People & population
Population85,878,5562025#18 of 193
Population density111.1 people/km²2024#80 of 193
Population growth rate0.42%2025#137 of 193
Urban population (share of people)89.5%2025#19 of 193
Life expectancy77.4 years2024#65 of 193
Fertility rate1.48 births per woman2024#140 of 193 tied
Infant mortality rate8.0 per 1,000 births2024#123 of 192 tied
Birth rate11.0 per 1,000 people2024#127 of 193 tied
Share of people aged 65 and over10.6%2025#75 of 193
Share of children aged 0–1421.0%2025#110 of 193
Life expectancy of women80.3 years2024#63 of 193
Life expectancy of men74.6 years2024#64 of 193
Maternal mortality ratio15 per 100,000 births2023#133 of 192 tied
City dwellers living in the largest city (share)21.1%2025#108 of 149
Death rate (per 1,000 people)5.7 per 1,000 people2024#153 of 193
Under-5 mortality (per 1,000 births)9.6 per 1,000 births2024#122 of 192 tied
Population aged 15–64 (share of population)68.4%2025#36 of 193
Economy
GDP (total)$1.6T2025#16 of 189
GDP per capita$18,5992025#62 of 189
GDP per capita (PPP)$45,2882025#48 of 185
Economic growth rate3.6%2025#84 of 188
Inflation rate34.9%2025#6 of 179
Unemployment rate8.5%2025#46 of 178
Exports (share of GDP)24.8%2025#115 of 168
Imports (share of GDP)25.1%2025#138 of 168
Agriculture (share of GDP)5.2%2025#101 of 184
Industry (share of GDP)24.0%2025#94 of 185
Services (share of GDP)59.4%2025#79 of 185
Military spending (share of GDP)1.9%2025#69 of 155
Income inequality (Gini index)43.7 (0–100)2023#21 of 149 tied
Goods exports (total)$273B2025#29 of 190
Money sent home by workers abroad (share of GDP)0.0%2025#161 of 170
Women in the labor force (share of women)37.1%2025#152 of 178
Youth unemployment rate16.0%2025#67 of 178
Cereal production39,017,292 t2024#15 of 177
Cereal yield (per hectare of farmland)3,429 kg/ha2024#84 of 175
Fish and seafood production (catch + farmed)933,119 t2024#27 of 193
Fish catch (from sea, rivers and lakes)355,995 t2024#45 of 193
Aquaculture (farmed fish and seafood)577,124 t2024#18 of 193
Livestock production growth (2014–16 = 100)135.4 (2014–16 average = 100)2024#31 of 187
Fertilizer use (per hectare of arable land)139 kg/ha2024#65 of 187
Manufacturing (share of GDP)16.8%2024#34 of 178
Employment in agriculture (share of jobs)14.2%2025#94 of 178
High-technology exports (share of manufactured exports)5.1%2024#97 of 168
Foreign direct investment, inflows (share of GDP)0.8%2025#141 of 187
Development aid received (share of national income)0.1%2023#118 of 132
Labor force (number of people)36,882,2252025#18 of 178
Reserves of foreign currency and gold$186B2025#20 of 169
Extreme poverty (share living on less than $3.00 a day)0.2%2023#106 of 132 tied
Daily life & technology
Internet users (share of people)89.8%2025#56 of 186
Mobile phone subscriptions107.8 per 100 people2024#120 of 193
Access to electricity (share of people)100.0%2024#1 of 193 tied
Health spending (share of GDP)4.3%2023#147 of 192
Education spending (share of GDP)3.1%2022#134 of 179
Hospital beds3.1 per 1,000 people2023#59 of 157
Doctors2.24 per 1,000 people2022#83 of 188
Research spending (share of GDP)1.42%2023#32 of 130
Women in parliament (share of seats)19.9%2025#126 of 192
University and college enrollment105.9%2023#8 of 163
Fixed broadband subscriptions23.4 per 100 people2024#70 of 192
Air passengers carried125,940,2412023#5 of 152
Safe sanitation (share of people)78.9%2024#49 of 136
Undernourishment (share of people)2.5%2024#102 of 165 tied
Clean cooking fuels (share of people)98.0%2024#63 of 192 tied
Road traffic deaths6.7 per 100,000 people2019#149 of 183 tied
Measles vaccination (share of children)95.0%2024#60 of 192 tied
Secondary school enrollment (gross)118.4%2023#18 of 180
Primary school completion rate90.6%2023#110 of 172
Nurses and midwives (per 1,000 people)3.48 per 1,000 people2022#103 of 190
Tuberculosis cases (per 100,000 people)13 per 100,000 people2024#132 of 191 tied
Health spending per person$5482023#84 of 192
Container port traffic (TEU)13,507,070 TEU2024#14 of 150
Environment
Renewable electricity (share of power)35.4%2021#79 of 187
CO₂ emissions per person5.4 t CO₂e per person2024#45 of 186
CO₂ emissions (total)460.0 Mt CO₂e2024#14 of 186
Air pollution (PM2.5)26.4 µg/m³2023#59 of 192
Energy use per person1,936 kg oil eq. per person2024#57 of 146
Renewable energy (share of final energy use)12.0%2021#134 of 191
Electricity consumption per person3,873 kWh per person2025#58 of 146
Electricity from nuclear power (share of total)0.0%2021#33 of 190 tied
Electricity from hydropower (share of total)15.8%2025#87 of 190
Greenhouse gas emissions (total)579.5 Mt CO₂e2024#16 of 186
Freshwater withdrawal (share of internal resources)28.4%2022#48 of 175
Food & farming
Wheat: production20,800,000 t2024#10 of 120
Rice: production1,019,000 t2024#41 of 114
Maize (corn): production8,100,000 t2024#19 of 160
Barley: production8,100,000 t2024#6 of 100
Sorghum: production96 t2024#100 of 107
Millet: production3,774 t2024#56 of 73
Oats: production390,000 t2024#16 of 74
Rye: production257,000 t2024#10 of 62
Potatoes: production6,900,000 t2024#11 of 150
Soybeans: production180,000 t2024#32 of 101 tied
Groundnuts (peanuts): production246,796 t2024#26 of 108
Rapeseed (canola): production61,664 t2024#39 of 63
Dry beans: production279,000 t2024#21 of 105
Chickpeas: production575,000 t2024#3 of 47
Lentils: production405,000 t2024#6 of 43
Dry peas: production5,353 t2024#55 of 95
Sunflower seeds: production2,195,000 t2024#5 of 73
Tomatoes: production14,617,000 t2024#3 of 164
Onions: production2,632,000 t2024#6 of 139
Cabbages: production912,839 t2024#11 of 143
Carrots (with turnips): production895,209 t2024#6 of 129
Cucumbers (with gherkins): production1,742,900 t2024#3 of 130
Lettuce (with chicory): production602,848 t2024#7 of 102
Cauliflower (with broccoli): production393,214 t2024#7 of 95
Eggplants (aubergines): production827,004 t2024#5 of 94
Green chilies and sweet peppers: production3,428,038 t2024#3 of 124
Mushrooms (with truffles): production75,340 t2024#13 of 63
Garlic: production50,870 t2024#25 of 102
Oranges: production1,610,000 t2024#13 of 112
Tangerines (mandarins): production1,988,000 t2024#4 of 70
Lemons (with limes): production1,730,000 t2024#5 of 101
Apples: production4,420,185 t2024#3 of 92
Bananas: production875,000 t2024#26 of 113
Grapes: production3,468,000 t2024#7 of 91
Strawberries: production606,254 t2024#5 of 80
Watermelons: production3,198,000 t2024#3 of 119
Peaches (with nectarines): production1,179,041 t2024#3 of 79
Avocados: production64,500 t2024#25 of 70
Olives: production3,750,000 t2024#2 of 40
Melons (cantaloupes and others): production1,479,000 t2024#4 of 95
Pears: production630,500 t2024#3 of 85
Plums (with sloes): production376,000 t2024#6 of 87
Apricots: production1,269,000 t2024#1 of 65
Cherries: production726,500 t2024#1 of 65
Grapefruits (with pomelos): production150,000 t2024#8 of 71
Almonds: production200,000 t2024#4 of 48
Walnuts: production426,000 t2024#3 of 55
Tea: production1,414,000 t2024#5 of 45
Sugar beet: production23,000,000 t2024#5 of 57
Cotton (fibre): production777,000 t2023#8 of 85
Tobacco: production108,000 t2024#10 of 117
Beef (cattle meat): production1,483,042 t2024#8 of 181
Chicken meat: production2,512,131 t2024#9 of 183
Cow’s milk: production21,040,442 t2024#10 of 178
Hen eggs: production1,322,193 t2024#9 of 167
Honey: production95,492 t2024#3 of 122
Sheep meat (mutton and lamb): production509,539 t2024#4 of 172
Goat meat: production99,532 t2024#10 of 164
Goat’s milk: production482,247 t2024#7 of 108
Butter (with ghee): production150,492 t2023#13 of 124
Cheese (all kinds): production830,204 t2023#7 of 105
Whiteleg shrimp: production20 t2024#42 of 54
Common carp: production3,215 t2024#27 of 97
African sharptooth catfish: production84 t2024#47 of 63
Rainbow trout: production230,159 t2024#2 of 79
Gilthead seabream: production155,852 t2024#1 of 31
European seabass: production165,055 t2024#1 of 29
Skipjack tuna: production425 t2024#54 of 82
Albacore: production150 t2024#38 of 60
Atlantic bluefin tuna: production8,778 t2024#3 of 32
Swordfish: production379 t2024#35 of 76
Atlantic mackerel: production47 t2024#23 of 29
Blue whiting: production742 t2024#15 of 21
European pilchard (sardine): production17,818 t2024#8 of 28
European anchovy: production153,175 t2024#1 of 36
European sprat: production16,067 t2024#8 of 24
Common octopus: production244 t2024#10 of 23
Seaweeds and other aquatic plants: production10 t2023#60 of 68 tied
Shrimps and prawns: production4,487 t2024#51 of 114
Crabs: production104 t2024#65 of 97
Lobsters: production2 t2024#87 of 91
Crayfish and other freshwater crustaceans: production748 t2024#21 of 64
Clams and cockles: production16,697 t2024#14 of 55
Mussels: production12,854 t2024#16 of 52
Squids, cuttlefish and octopuses: production1,290 t2024#51 of 102
Tunas, bonitos and billfishes: production60,644 t2024#31 of 133
Carps and other cyprinids: production23,040 t2024#28 of 115
Herrings, sardines and anchovies: production187,353 t2024#20 of 108
Cods, hakes and haddocks: production9,464 t2024#29 of 65
Flatfishes (flounders, halibuts, soles): production655 t2024#48 of 91
Freshwater eels: production280 t2024#15 of 41
Sea urchins, sea cucumbers and other echinoderms: production1,220 t2024#14 of 48
Sharks and rays: production1 t2024#125 of 127
Cattle: number of animals16,824,208 animals2024#20 of 183
Pigs: number of animals1,724 animals2024#162 of 165
Chickens: number of animals379,627,000 birds2024#11 of 181
Sheep: number of animals44,080,584 animals2024#7 of 173
Goats: number of animals10,822,084 animals2024#22 of 180
Horses: number of animals70,360 animals2024#59 of 143
Buffaloes: number of animals162,051 animals2024#20 of 45
Camels: number of animals1,137 animals2024#40 of 46
Donkeys: number of animals65,003 animals2024#36 of 104
Ducks: number of animals390,000 birds2024#43 of 80
Turkeys: number of animals2,827,000 birds2024#16 of 71

Questions about Türkiye

What is the capital of Türkiye?

The capital of Türkiye is Ankara.

What is the population of Türkiye?

Türkiye has a population of about 85.9M (2025), #18 of 193 among countries.

How big is Türkiye?

Türkiye covers about 785,350 km², #36 of 193 among countries.

Which continent is Türkiye in?

Türkiye is in Asia, in the region of Western Asia.

What is Türkiye number one in the world for in food and farming?

Türkiye ranks first in the world for: Apricots 1.27M t, Cherries 727K t, Gilthead seabream 156K t, European seabass 165K t, European anchovy 153K t (FAO data).

What currency and languages are used in Türkiye?

The currency is the Turkish Lira. Main languages: Turkish.

How does Türkiye compare with Japan in size and population?

The area of Türkiye is about 2.1 times that of Japan, and its population is about 0.7 times that of Japan.

How far is Türkiye from Japan?

The capital, Ankara, is about 8,764 km from Tokyo, the capital of Japan, in a straight line.

What is the time difference between Türkiye and Japan?

The capital, Ankara, is on UTC+3 in standard time: 6 h behind Japan.

What is the largest city in Türkiye?

The largest city in Türkiye is Istanbul. The capital is Ankara.

More countries in Western Asia

Play with Türkiye

Test what you learned in the quiz.

Map puzzle Quiz Rankings

Back to top