
Intentional homicides over time (2000–2021)
Follow intentional homicides for the world’s countries, year by year, from 2000 to 2021.
- The country ranked first changed over time: Colombia in 2000–2003, El Salvador in 2004–2006, Jamaica in 2007–2008, El Salvador in 2009, Honduras in 2010–2014, El Salvador in 2015–2018, Jamaica in 2019–2021.
- Japan’s intentional homicides went from 0.53 per 100,000 people in 2000 to 0.23 per 100,000 people in 2021 (down about 58%).
- Japan ranked #108 of 109 countries in 2000 and #107 of 109 in 2021. The number of countries differs between the years, so the ranks are not directly comparable.
Japan and the leading countries
| Country | 2000 | 2010 | 2021 |
|---|---|---|---|
 Jamaica | 34.01 per 100,000 people | 52.65 per 100,000 people | 51.94 per 100,000 people |
 South Africa | 46.14 per 100,000 people | 30.36 per 100,000 people | 40.94 per 100,000 people |
 St. Lucia | 14.50 per 100,000 people | 25.75 per 100,000 people | 39.21 per 100,000 people |
 Honduras | 48.28 per 100,000 people | 74.54 per 100,000 people | 38.20 per 100,000 people |
 Belize | 17.03 per 100,000 people | 40.28 per 100,000 people | 31.62 per 100,000 people |
 Japan | 0.53 per 100,000 people | 0.36 per 100,000 people | 0.23 per 100,000 people |
| Countries with data | 109 | 143 | 109 |
Ranking and map for any year
Choose a year to see that year’s top countries and the world map. Colors split that year’s ranking into seven steps.
| Rank | Country | Intentional homicides |
|---|
Biggest changes, 2000–2021
Compared among the countries that have data in both 2000 and 2021. Countries with a very small starting value are left out, because their ratios look exaggerated.
| Country | 2000 | 2021 | Change | Rank |
|---|---|---|---|---|
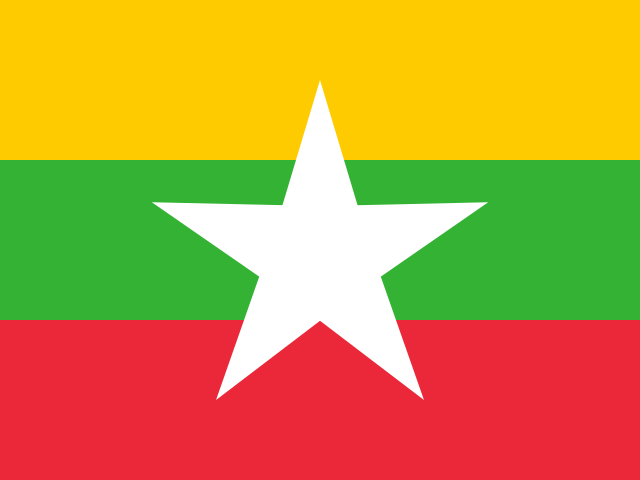 Myanmar | 2.30 per 100,000 people | 28.66 per 100,000 people | about 12× | #72 → #10 |
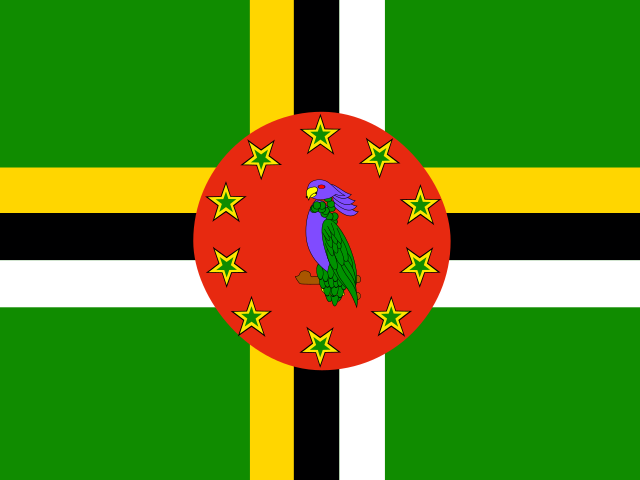 Dominica | 2.92 per 100,000 people | 14.88 per 100,000 people | about 5.1× | #60 → #19 |
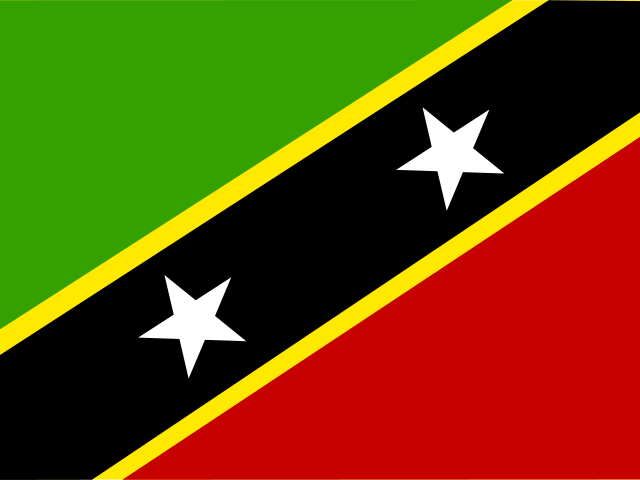 St. Kitts & Nevis | 6.63 per 100,000 people | 29.94 per 100,000 people | about 4.5× | #40 → #9 |
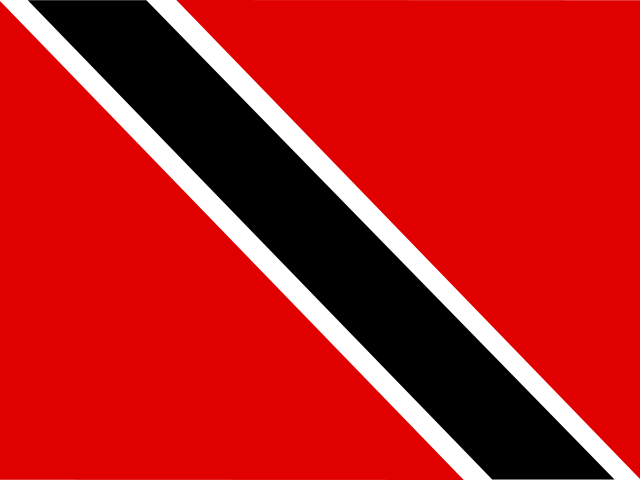 Trinidad & Tobago | 9.09 per 100,000 people | 30.11 per 100,000 people | about 3.3× | #31 → #7 |
| St. Lucia | 14.50 per 100,000 people | 39.21 per 100,000 people | about 2.7× | #16 → #3 |
| Country | 2000 | 2021 | Change | Rank |
|---|---|---|---|---|
 Singapore | 1.02 per 100,000 people | 0.11 per 100,000 people | down about 89% | #100 → #108 |
 Kazakhstan | 15.00 per 100,000 people | 2.85 per 100,000 people | down about 81% | #15 → #52 |
 Estonia | 10.24 per 100,000 people | 1.95 per 100,000 people | down about 81% | #24 → #60 |
 Moldova | 10.22 per 100,000 people | 2.18 per 100,000 people | down about 79% | #25 → #58 |
 Slovenia | 1.81 per 100,000 people | 0.43 per 100,000 people | down about 76% | #81 → #103 |
Myanmar’s value for 2021 is about 10 times the year before, far above the usual. It may be linked to the turmoil after the military takeover that year, but the source does not confirm the reason. The numbers are shown exactly as the source gives them.
The number of countries differs between the years, so the ranks are not directly comparable.
All countries in key years
Open the table (countries with data)
| Country | 2000 | 2010 | 2021 |
|---|---|---|---|
| Jamaica | 34.01 per 100,000 people | 52.65 per 100,000 people | 51.94 per 100,000 people |
| South Africa | 46.14 per 100,000 people | 30.36 per 100,000 people | 40.94 per 100,000 people |
| St. Lucia | 14.50 per 100,000 people | 25.75 per 100,000 people | 39.21 per 100,000 people |
| Honduras | 48.28 per 100,000 people | 74.54 per 100,000 people | 38.20 per 100,000 people |
| Belize | 17.03 per 100,000 people | 40.28 per 100,000 people | 31.62 per 100,000 people |
 St. Vincent & Grenadines | 17.61 per 100,000 people | 22.74 per 100,000 people | 31.12 per 100,000 people |
| Trinidad & Tobago | 9.09 per 100,000 people | 34.11 per 100,000 people | 30.11 per 100,000 people |
 Bahamas | 22.85 per 100,000 people | 25.58 per 100,000 people | 30.02 per 100,000 people |
| St. Kitts & Nevis | 6.63 per 100,000 people | 44.83 per 100,000 people | 29.94 per 100,000 people |
| Myanmar | 2.30 per 100,000 people | 1.63 per 100,000 people | 28.66 per 100,000 people |
 Mexico | 10.89 per 100,000 people | 22.67 per 100,000 people | 27.97 per 100,000 people |
 Colombia | 67.89 per 100,000 people | 34.52 per 100,000 people | 25.58 per 100,000 people |
 Brazil | 26.07 per 100,000 people | 26.99 per 100,000 people | 20.50 per 100,000 people |
 Guatemala | 24.83 per 100,000 people | 41.10 per 100,000 people | 20.25 per 100,000 people |
 Venezuela | 32.71 per 100,000 people | 45.40 per 100,000 people | 19.28 per 100,000 people |
 El Salvador | 59.75 per 100,000 people | 65.70 per 100,000 people | 17.34 per 100,000 people |
 Antigua & Barbuda | 6.67 per 100,000 people | 7.03 per 100,000 people | 17.33 per 100,000 people |
 Guyana | 9.94 per 100,000 people | 18.69 per 100,000 people | 16.06 per 100,000 people |
| Dominica | 2.92 per 100,000 people | 21.78 per 100,000 people | 14.88 per 100,000 people |
 Haiti | – | 6.91 per 100,000 people | 14.20 per 100,000 people |
 Ecuador | 14.45 per 100,000 people | 17.40 per 100,000 people | 14.12 per 100,000 people |
 Panama | 9.93 per 100,000 people | 12.68 per 100,000 people | 12.66 per 100,000 people |
 Eswatini | 12.29 per 100,000 people | 18.71 per 100,000 people | 12.51 per 100,000 people |
 Costa Rica | 6.32 per 100,000 people | 11.57 per 100,000 people | 11.62 per 100,000 people |
 Botswana | – | 14.90 per 100,000 people | 11.37 per 100,000 people |
 Nicaragua | 9.48 per 100,000 people | 13.68 per 100,000 people | 11.35 per 100,000 people |
 Barbados | 7.63 per 100,000 people | 11.26 per 100,000 people | 11.34 per 100,000 people |
 Namibia | 20.89 per 100,000 people | 14.88 per 100,000 people | 11.21 per 100,000 people |
 Dominican Republic | 14.10 per 100,000 people | 25.19 per 100,000 people | 10.54 per 100,000 people |
 Uruguay | 6.55 per 100,000 people | 6.18 per 100,000 people | 9.01 per 100,000 people |
 Peru | – | – | 8.60 per 100,000 people |
 Uganda | – | 9.76 per 100,000 people | 8.52 per 100,000 people |
 Paraguay | 19.51 per 100,000 people | 12.91 per 100,000 people | 7.85 per 100,000 people |
 United States | 5.54 per 100,000 people | 4.73 per 100,000 people | 6.78 per 100,000 people |
 Russia | 28.01 per 100,000 people | 11.60 per 100,000 people | 6.77 per 100,000 people |
 Zimbabwe | – | 5.32 per 100,000 people | 6.22 per 100,000 people |
 Mongolia | – | 8.85 per 100,000 people | 6.17 per 100,000 people |
 Suriname | 14.27 per 100,000 people | – | 5.66 per 100,000 people |
 Kenya | – | 4.63 per 100,000 people | 5.25 per 100,000 people |
 Liechtenstein | – | 2.78 per 100,000 people | 5.12 per 100,000 people |
 Chile | – | 3.15 per 100,000 people | 4.66 per 100,000 people |
 Argentina | – | 5.77 per 100,000 people | 4.62 per 100,000 people |
 Grenada | 13.96 per 100,000 people | 8.96 per 100,000 people | 4.28 per 100,000 people |
 Seychelles | – | 9.48 per 100,000 people | 4.07 per 100,000 people |
 Afghanistan | – | 3.48 per 100,000 people | 4.03 per 100,000 people |
 Pakistan | 5.75 per 100,000 people | 6.62 per 100,000 people | 3.79 per 100,000 people |
 Ukraine | 8.92 per 100,000 people | 4.28 per 100,000 people | 3.78 per 100,000 people |
 Bolivia | – | – | 3.50 per 100,000 people |
 Armenia | 2.91 per 100,000 people | 1.91 per 100,000 people | 3.14 per 100,000 people |
 Latvia | 10.05 per 100,000 people | – | 3.02 per 100,000 people |
 India | 4.55 per 100,000 people | 3.74 per 100,000 people | 2.92 per 100,000 people |
| Kazakhstan | 15.00 per 100,000 people | 8.24 per 100,000 people | 2.85 per 100,000 people |
 Mauritius | 2.14 per 100,000 people | 2.57 per 100,000 people | 2.66 per 100,000 people |
 Lithuania | 10.57 per 100,000 people | 7.07 per 100,000 people | 2.58 per 100,000 people |
 Türkiye | – | 4.18 per 100,000 people | 2.50 per 100,000 people |
 Montenegro | – | 2.37 per 100,000 people | 2.48 per 100,000 people |
 Albania | 4.14 per 100,000 people | 4.06 per 100,000 people | 2.32 per 100,000 people |
| Moldova | 10.22 per 100,000 people | 7.30 per 100,000 people | 2.18 per 100,000 people |
 Canada | 1.77 per 100,000 people | 1.63 per 100,000 people | 2.08 per 100,000 people |
| Estonia | 10.24 per 100,000 people | 5.26 per 100,000 people | 1.95 per 100,000 people |
 Morocco | 1.62 per 100,000 people | 1.39 per 100,000 people | 1.94 per 100,000 people |
 Israel | 2.52 per 100,000 people | 2.04 per 100,000 people | 1.93 per 100,000 people |
 Ghana | – | 1.66 per 100,000 people | 1.85 per 100,000 people |
 Fiji | – | 2.20 per 100,000 people | 1.75 per 100,000 people |
 Azerbaijan | 2.76 per 100,000 people | 2.25 per 100,000 people | 1.70 per 100,000 people |
 Algeria | – | 0.70 per 100,000 people | 1.55 per 100,000 people |
 Uzbekistan | 4.31 per 100,000 people | – | 1.40 per 100,000 people |
 Bulgaria | 4.15 per 100,000 people | 1.99 per 100,000 people | 1.29 per 100,000 people |
 Finland | 2.86 per 100,000 people | 2.20 per 100,000 people | 1.28 per 100,000 people |
 Romania | 2.52 per 100,000 people | 1.30 per 100,000 people | 1.27 per 100,000 people |
 Cyprus | 0.84 per 100,000 people | 0.71 per 100,000 people | 1.21 per 100,000 people |
 New Zealand | 1.35 per 100,000 people | 0.99 per 100,000 people | 1.16 per 100,000 people |
 Serbia | 2.96 per 100,000 people | 1.78 per 100,000 people | 1.13 per 100,000 people |
 United Kingdom | 1.54 per 100,000 people | 1.20 per 100,000 people | 1.12 per 100,000 people |
 France | 1.77 per 100,000 people | 1.26 per 100,000 people | 1.11 per 100,000 people |
 Sweden | 1.08 per 100,000 people | 0.97 per 100,000 people | 1.08 per 100,000 people |
 Belgium | 2.07 per 100,000 people | – | 1.08 per 100,000 people |
 Jordan | – | 1.75 per 100,000 people | 1.03 per 100,000 people |
 Slovakia | 2.40 per 100,000 people | 1.65 per 100,000 people | 1.01 per 100,000 people |
 Bosnia & Herzegovina | 2.38 per 100,000 people | 1.47 per 100,000 people | 0.99 per 100,000 people |
 Greece | – | 1.58 per 100,000 people | 0.84 per 100,000 people |
 Croatia | 2.33 per 100,000 people | 1.44 per 100,000 people | 0.84 per 100,000 people |
 Germany | 1.67 per 100,000 people | 0.98 per 100,000 people | 0.83 per 100,000 people |
 Portugal | 1.13 per 100,000 people | 1.17 per 100,000 people | 0.79 per 100,000 people |
 Hungary | 2.01 per 100,000 people | 1.38 per 100,000 people | 0.77 per 100,000 people |
 North Macedonia | 2.28 per 100,000 people | 2.10 per 100,000 people | 0.76 per 100,000 people |
 Australia | 1.89 per 100,000 people | 1.04 per 100,000 people | 0.74 per 100,000 people |
 Austria | 1.02 per 100,000 people | 0.73 per 100,000 people | 0.72 per 100,000 people |
 Poland | 2.23 per 100,000 people | 1.01 per 100,000 people | 0.72 per 100,000 people |
 Netherlands | 1.12 per 100,000 people | 0.86 per 100,000 people | 0.71 per 100,000 people |
 Malaysia | 2.40 per 100,000 people | 1.88 per 100,000 people | 0.71 per 100,000 people |
 Denmark | 1.09 per 100,000 people | 0.76 per 100,000 people | 0.63 per 100,000 people |
 Luxembourg | 0.92 per 100,000 people | 1.97 per 100,000 people | 0.62 per 100,000 people |
 Spain | 1.35 per 100,000 people | 0.86 per 100,000 people | 0.61 per 100,000 people |
 Iceland | 1.78 per 100,000 people | 0.63 per 100,000 people | 0.54 per 100,000 people |
 Norway | 1.07 per 100,000 people | 0.59 per 100,000 people | 0.54 per 100,000 people |
 Italy | 1.34 per 100,000 people | 0.88 per 100,000 people | 0.51 per 100,000 people |
 Switzerland | 0.96 per 100,000 people | 0.66 per 100,000 people | 0.48 per 100,000 people |
 South Korea | 0.79 per 100,000 people | 0.99 per 100,000 people | 0.47 per 100,000 people |
 United Arab Emirates | – | 0.97 per 100,000 people | 0.45 per 100,000 people |
 Czechia | 1.87 per 100,000 people | 0.98 per 100,000 people | 0.45 per 100,000 people |
 Ireland | 0.97 per 100,000 people | 1.18 per 100,000 people | 0.44 per 100,000 people |
| Slovenia | 1.81 per 100,000 people | 0.73 per 100,000 people | 0.43 per 100,000 people |
 Malta | 1.00 per 100,000 people | 0.95 per 100,000 people | 0.38 per 100,000 people |
 Qatar | 0.16 per 100,000 people | 0.23 per 100,000 people | 0.32 per 100,000 people |
 Oman | – | 1.74 per 100,000 people | 0.24 per 100,000 people |
| Japan | 0.53 per 100,000 people | 0.36 per 100,000 people | 0.23 per 100,000 people |
| Singapore | 1.02 per 100,000 people | 0.37 per 100,000 people | 0.11 per 100,000 people |
 Bahrain | – | 0.16 per 100,000 people | 0.07 per 100,000 people |
 Andorra | – | – | – |
 Angola | – | – | – |
 Bangladesh | 2.48 per 100,000 people | 2.62 per 100,000 people | – |
 Burkina Faso | – | 0.79 per 100,000 people | – |
 Burundi | – | – | – |
 Benin | – | – | – |
 Brunei | 1.23 per 100,000 people | 0.25 per 100,000 people | – |
 Bhutan | 3.02 per 100,000 people | 2.28 per 100,000 people | – |
 Belarus | 10.14 per 100,000 people | 4.23 per 100,000 people | – |
 Central African Republic | – | – | – |
 Cameroon | 3.08 per 100,000 people | 5.08 per 100,000 people | – |
 China | – | 0.99 per 100,000 people | – |
 Cuba | 5.28 per 100,000 people | 4.47 per 100,000 people | – |
 Cape Verde | – | – | – |
 Egypt | – | 2.06 per 100,000 people | – |
 Eritrea | – | – | – |
 Ethiopia | – | – | – |
 Micronesia | – | – | – |
 Georgia | 5.52 per 100,000 people | 4.80 per 100,000 people | – |
 Guinea-Bissau | – | – | – |
 Indonesia | 1.02 per 100,000 people | – | – |
 Iraq | – | 8.67 per 100,000 people | – |
 Iran | – | – | – |
 Kyrgyzstan | 8.74 per 100,000 people | 16.76 per 100,000 people | – |
 Cambodia | 4.58 per 100,000 people | 2.28 per 100,000 people | – |
 Kiribati | 3.39 per 100,000 people | 3.68 per 100,000 people | – |
 Kuwait | – | 2.04 per 100,000 people | – |
 Lebanon | – | 3.23 per 100,000 people | – |
 Sri Lanka | – | 3.65 per 100,000 people | – |
 Liberia | – | 3.18 per 100,000 people | – |
 Lesotho | – | – | – |
 Monaco | – | – | – |
 Mauritania | – | – | – |
 Maldives | – | 1.66 per 100,000 people | – |
 Malawi | 6.19 per 100,000 people | 3.51 per 100,000 people | – |
 Mozambique | – | 3.80 per 100,000 people | – |
 Niger | – | – | – |
 Nigeria | – | – | – |
 Nepal | 2.59 per 100,000 people | 2.97 per 100,000 people | – |
 Papua New Guinea | 8.40 per 100,000 people | 9.34 per 100,000 people | – |
 Philippines | 7.20 per 100,000 people | 8.97 per 100,000 people | – |
 Palau | – | – | – |
 Rwanda | – | 2.82 per 100,000 people | – |
 Saudi Arabia | 1.07 per 100,000 people | – | – |
 Solomon Islands | – | – | – |
 Sudan | – | – | – |
 Sierra Leone | – | 2.62 per 100,000 people | – |
 San Marino | – | – | – |
 Senegal | – | – | – |
 South Sudan | – | – | – |
 São Tomé & Príncipe | – | 3.30 per 100,000 people | – |
 Syria | 2.15 per 100,000 people | 2.06 per 100,000 people | – |
 Thailand | 8.16 per 100,000 people | 5.33 per 100,000 people | – |
 Tajikistan | 4.50 per 100,000 people | 2.37 per 100,000 people | – |
 Timor-Leste | – | 3.60 per 100,000 people | – |
 Turkmenistan | 5.83 per 100,000 people | 1.89 per 100,000 people | – |
 Tunisia | – | 2.66 per 100,000 people | – |
 Tonga | 0.97 per 100,000 people | 0.93 per 100,000 people | – |
 Tuvalu | – | 9.42 per 100,000 people | – |
 Tanzania | – | 8.69 per 100,000 people | – |
 Vietnam | – | 1.53 per 100,000 people | – |
 Vanuatu | – | – | – |
 Samoa | – | 8.29 per 100,000 people | – |
 Yemen | 3.55 per 100,000 people | 4.11 per 100,000 people | – |
 Zambia | 7.96 per 100,000 people | 5.83 per 100,000 people | – |
| Countries with data | 109 | 143 | 109 |
Notes on reading this history
Yearly values come from the same World Bank indicator. The number of countries with data differs by year, so each year’s ranks are given only among the countries that have data that year. The ranking page uses each country’s latest year, so it may not match a single year’s ranking here.
In countries with few people, a few cases can change the value a lot, so year-to-year swings can look large.
Source: Intentional homicides (per 100,000 people), indicator VC.IHR.PSRC.P5. Processed by this site. data.worldbank.org
World Bank data last updated: 2026-11-11
More indicators over time
- Latest ranking: Intentional homicides
- GDP (total)
- GDP per capita
- Infant mortality rate
- Internet users (share of people)
- Access to electricity (share of people)
- CO₂ emissions per person
- CO₂ emissions (total)
- Urban population (share of people)
- Goods exports (total)
- Air passengers carried
- Women in the labor force (share of women)
- Women in parliament (share of seats)
- Measles vaccination (share of children)
- Renewable electricity (share of power)
- Air pollution (PM2.5)
- Health spending (share of GDP)
- Rice production
- Wheat production
- Maize (corn) production
- Potatoes production
- Tomatoes production
- Bananas production
- Cow’s milk production
- Hen eggs production
- Chicken meat production
- Beef (cattle meat) production
- Pork (pig meat) production
- Soybeans production
- Coffee production
- Cocoa beans production
- Sugar cane production
- Cassava production
- Oranges production
- Apples production
- Onions production
- Cattle number of animals
- Pigs number of animals
- Sheep number of animals
- Chickens number of animals
- Barley production
- Sorghum production
- Millet production
- Sweet potatoes production
- Groundnuts (peanuts) production
- Rapeseed (canola) production
- Sunflower seeds production
- Dry beans production
- Palm oil production
- Grapes production
- Mangoes (with guavas and mangosteens) production
- Pineapples production
- Watermelons production
- Lemons (with limes) production
- Cabbages production
- Cucumbers (with gherkins) production
- Tea production
- Sugar beet production
- Cotton (fibre) production
- Honey production
- Sheep meat (mutton and lamb) production
- Goat meat production
- Goats number of animals
- Horses number of animals
- Cereal production
- Cereal yield (per hectare of farmland)
- Fish and seafood production (catch + farmed)
- Fish catch (from sea, rivers and lakes)
- Aquaculture (farmed fish and seafood)
- Energy use per person
- Electricity consumption per person
- Greenhouse gas emissions (total)
- Safe drinking water (share of people)
- Safe sanitation (share of people)
- Clean cooking fuels (share of people)
- Labor force (number of people)
- Employment in agriculture (share of jobs)
- Manufacturing (share of GDP)
- Reserves of foreign currency and gold
- Money sent home by workers abroad (share of GDP)
- Tuberculosis cases (per 100,000 people)
- Health spending per person
- Oats production
- Rye production
- Yams production
- Chickpeas production
- Lentils production
- Dry peas production
- Coconuts production
- Carrots (with turnips) production
- Lettuce (with chicory) production
- Cauliflower (with broccoli) production
- Eggplants (aubergines) production
- Green chilies and sweet peppers production
- Garlic production
- Tangerines (mandarins) production
- Strawberries production
- Peaches (with nectarines) production
- Avocados production
- Dates production
- Olives production
- Melons (cantaloupes and others) production
- Pears production
- Plums (with sloes) production
- Apricots production
- Cherries production
- Papayas production
- Grapefruits (with pomelos) production
- Tobacco production
- Goat’s milk production
- Butter (with ghee) production
- Cheese (all kinds) production
- Buffaloes number of animals
- Camels number of animals
- Donkeys number of animals
- Ducks number of animals
- Turkeys number of animals
- Forest area
- Agricultural land (share of land)
- Arable land (share of land)
- Under-5 mortality (per 1,000 births)
- Maternal mortality ratio
- Exports (share of GDP)
- Imports (share of GDP)
- Agriculture (share of GDP)
- Industry (share of GDP)
- Services (share of GDP)
- Military spending (share of GDP)
- Renewable energy (share of final energy use)
- Electricity from hydropower (share of total)
- Shrimps and prawns production
- Crabs production
- Lobsters production
- Crayfish and other freshwater crustaceans production
- Oysters production
- Clams and cockles production
- Scallops production
- Mussels production
- Squids, cuttlefish and octopuses production
- Tunas, bonitos and billfishes production
- Carps and other cyprinids production
- Tilapias and other cichlids production
- Herrings, sardines and anchovies production
- Cods, hakes and haddocks production
- Flatfishes (flounders, halibuts, soles) production
- Freshwater eels production
- Sea urchins, sea cucumbers and other echinoderms production
- Sharks and rays production
- Seaweeds and other aquatic plants production
- Whiteleg shrimp production
- Giant tiger prawn production
- Giant river prawn production
- Nile tilapia production
- Grass carp production
- Silver carp production
- Common carp production
- Bighead carp production
- African sharptooth catfish production
- Milkfish production
- Barramundi (giant sea perch) production
- Atlantic salmon production
- Rainbow trout production
- Gilthead seabream production
- European seabass production
- Pacific cupped oyster production
- Skipjack tuna production
- Yellowfin tuna production
- Bigeye tuna production
- Albacore production
- Atlantic bluefin tuna production
- Swordfish production
- Atlantic herring production
- Atlantic mackerel production
- Atlantic cod production
- Haddock production
- Blue whiting production
- European pilchard (sardine) production
- European anchovy production
- European sprat production
- Largehead hairtail (cutlassfish) production
- Common octopus production